


Gantt chart template
Use a ready-made Gantt chart template to map tasks, deadlines, and dependencies so your team can clearly see timelines and keep work moving.
Sign up to create your own template.
Gantt chart template
Use a ready-made Gantt chart template to map tasks, deadlines, and dependencies so your team can clearly see timelines and keep work moving.
Use templateSign up to create your own template.
INTEGRATED FEATURES
Recommended apps



Summary
Whether you're planning a product launch or coordinating a cross-functional initiative, keeping your project timeline visible is key. A Gantt chart template gives you a ready-made way to map out tasks, spot dependencies, and share progress with your team. In this guide, you'll learn what Gantt charts and Gantt chart dependencies are, how to use a template for project planning, and explore examples you can customize for your own projects.

What is a Gantt chart?
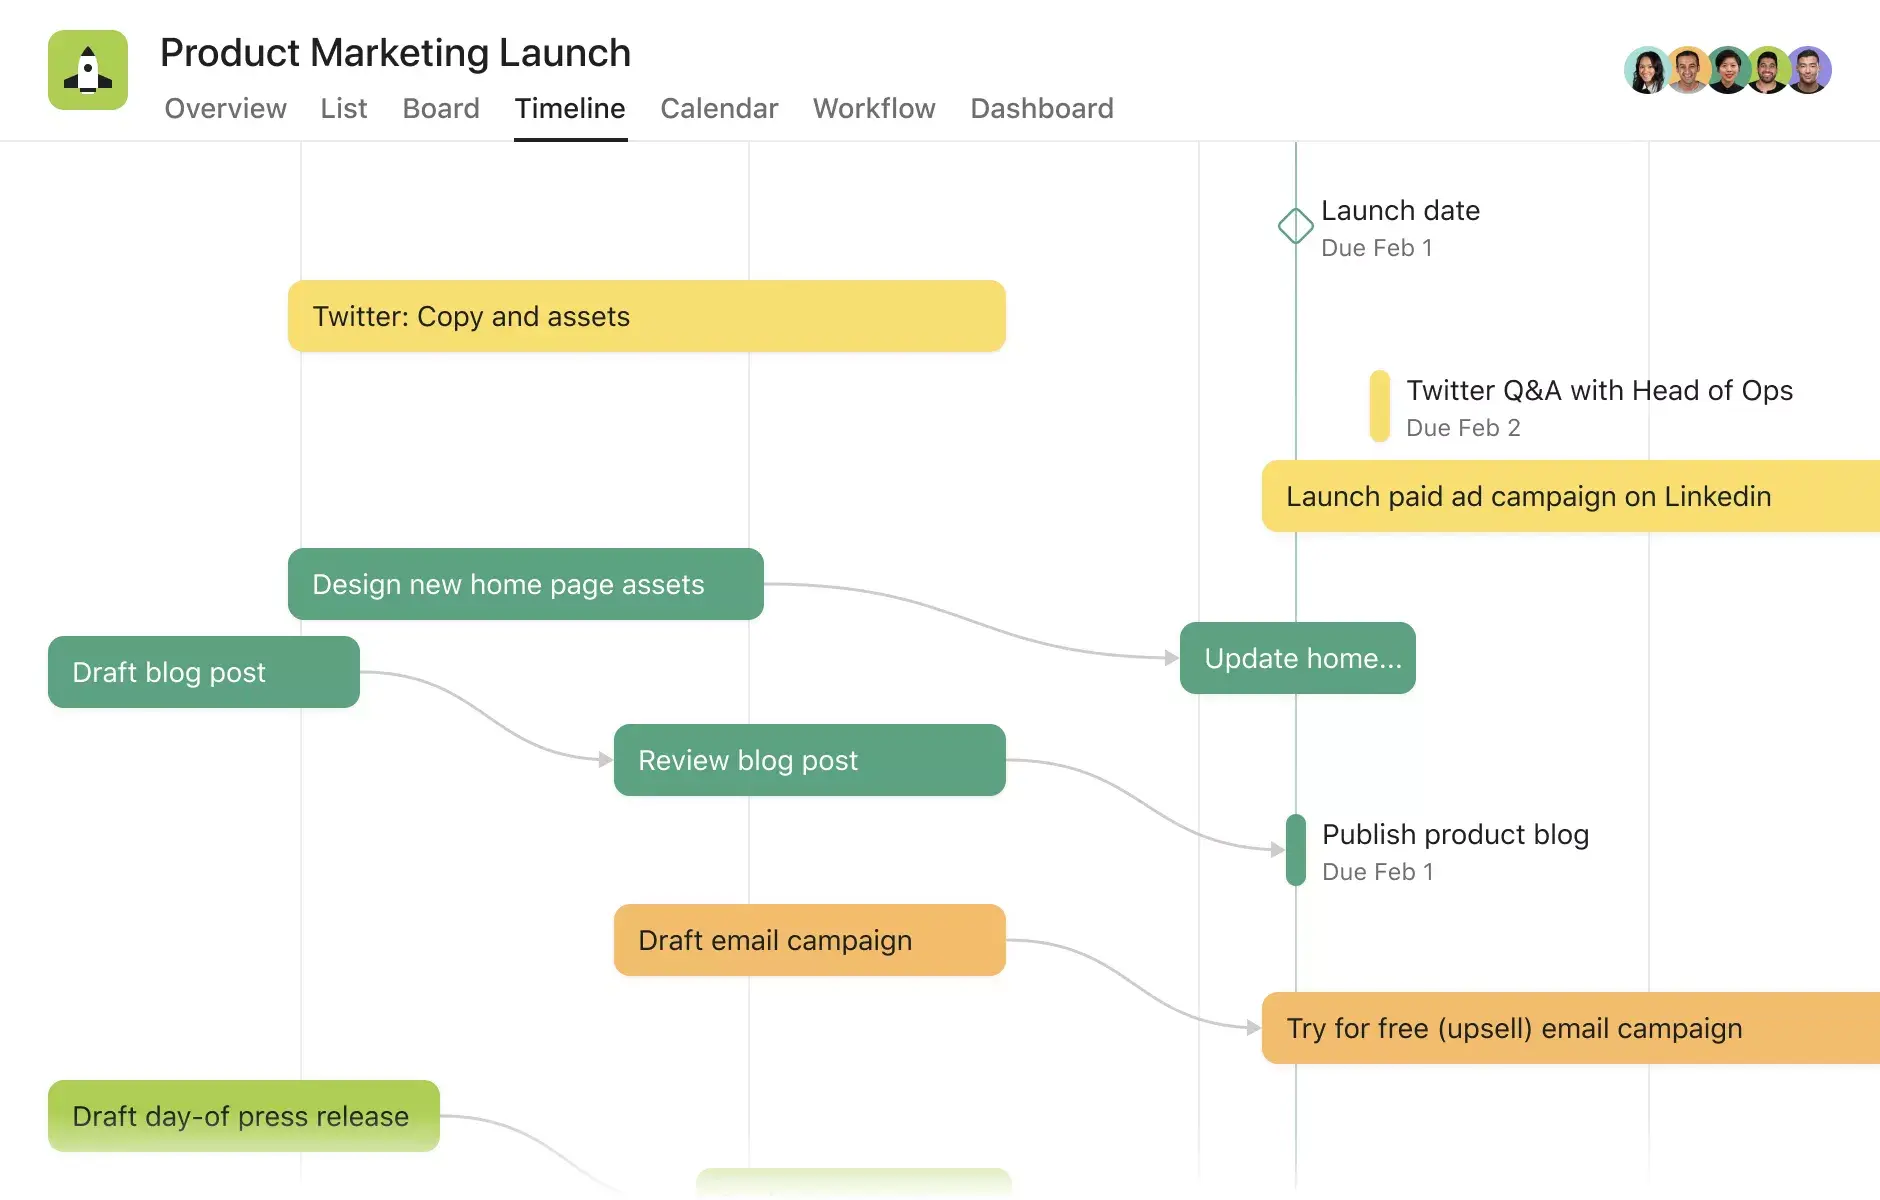
A Gantt chart is a horizontal bar chart that shows your project's tasks over time. Each bar represents a single task, and its length shows the task's duration, so you can quickly see what's happening, when it's due, and how work overlaps.
At a glance, a Gantt chart helps you visualize:
Task timelines: Start and end dates for every task in your project
Milestones: Key checkpoints that mark important progress
Dependencies: Which tasks need to finish before others can start
Blockers: Potential scheduling conflicts or delays
Many Gantt charts also show a time scale (days, weeks, or months across the top), each task's owner, and the critical path. The critical path is the longest chain of dependent tasks, and it sets your project's end date. If you miss a task on the critical path, you'll also miss your deadline.
What is a Gantt chart template?
A Gantt chart template is a reusable project timeline you can adjust for any new project. Instead of starting from scratch every time, a template gives you a structure with the basics already in place. A typical Gantt chart template includes space for:
Task lists: All the work that needs to be done
Task owners: Who's responsible for each piece of work
Task dependencies: Which tasks are connected and need to happen in order
Start and end dates: A clearly defined timeline for every task
Because the template is reusable, it streamlines your workflows and reduces the upfront work of building project timelines.

What are Gantt chart dependencies?
Gantt chart dependencies show how tasks are connected and the order in which they must be completed. If one task has to wait for another to finish before it can start, that’s a dependency. On a Gantt chart, these are usually shown as lines or arrows between tasks, making it easy to see how everything fits together. Understanding dependencies is essential for realistic project planning. There are four common types of task dependencies:
Finish-to-start (FS): Task B can't start until Task A finishes. This is the most common dependency type. For example, you can't begin user testing until the prototype is complete.
Start-to-start (SS): Task B can't start until Task A starts. Both tasks can run in parallel, but one must kick off first.
Finish-to-finish (FF): Task B can't finish until Task A finishes. Both tasks may be in progress at the same time, but they need to wrap up together.
Start-to-finish (SF): Task B can't finish until Task A starts. This is the least common type, but it's useful in scheduling scenarios where a new process replaces an old one.
With a Gantt chart template that includes dependencies, you can plan these connections early and catch scheduling issues before they cause delays. In tools like Asana, dependencies update automatically, so if one task changes, the related tasks adjust automatically.
Use a Gantt chart templateHow to use your Gantt chart template for project planning
Building your template is the more time-consuming part. Once it's done, you can duplicate it and fill in the blanks for each new project. If you’ve used Gantt chart templates in spreadsheets, you know they can be slow and require a lot of manual updates. An online tool makes changes easier and updates instantly. For example: An online Gantt chart template can.
Give all stakeholders a quick, bird's-eye view of your project.
Keep your project on track with clear, easy-to-reference deadlines.
Reduce confusion and miscommunication and improve team collaboration.
Automate processes through dependencies and robust customization, especially when you use supporting software.
Keep in mind that a Gantt chart template doesn’t replace project management once your project starts. Templates are most helpful during planning and production.
How to make a Gantt chart template
To create your own Gantt chart template, start by considering the use case and complexity of your typical projects. Depending on what you need, you might include more or less detail:
As a project schedule: Focus on assigning tasks, setting deadlines, and delegating work.
As a project information source: Focus on how your team will attach documents, track processes, and share updates.
As both: Combine task assignments with document tracking for a complete project hub. Often, you'll use it for both.
Once you decide how you'll use your template, begin the process of building it:
Brainstorm the elements you need to map and track in a project. These will be your inputs, and you'll want to include space for each category in your templates. Possible inputs include: start dates, end dates, independent and dependent tasks, project milestones, roles, subtasks, and descriptions.
Gather information and relevant resources. Attach recurring worksheets, relevant roadmaps, documents, analysis results, reporting dashboards, goals, assigned roles, and processes.
Enter your information into a single central source of truth, such as task management software. Be sure to include recurring dependencies and roles. The more thought you put into your template, the less work you'll have when it's time to launch your next project.
Add integrations and apps to support your work. If you're in a project management tool, you can directly attach your Google Sheets, Kanban boards, and references (like tutorial PowerPoints) to your project timeline.
For more complex projects, a simple spreadsheet likely won't offer enough customization. Here's how spreadsheet templates compare to dedicated project management tools:
Real-time updates: Spreadsheets need manual edits; project management tools update automatically
Dependencies: Spreadsheets lack built-in dependency tracking; project management tools map dependencies visually
Collaboration: Spreadsheets can create version conflicts; project management tools centralize comments and assignments
Integrations: Spreadsheets offer limited connections; project management tools connect with 260+ apps
Reusability: Spreadsheets require manual setup; project management tools let you duplicate templates quickly
Examples of Gantt chart templates
You can use Gantt chart templates for many kinds of projects. Here are a few examples to help you keep your projects on track.
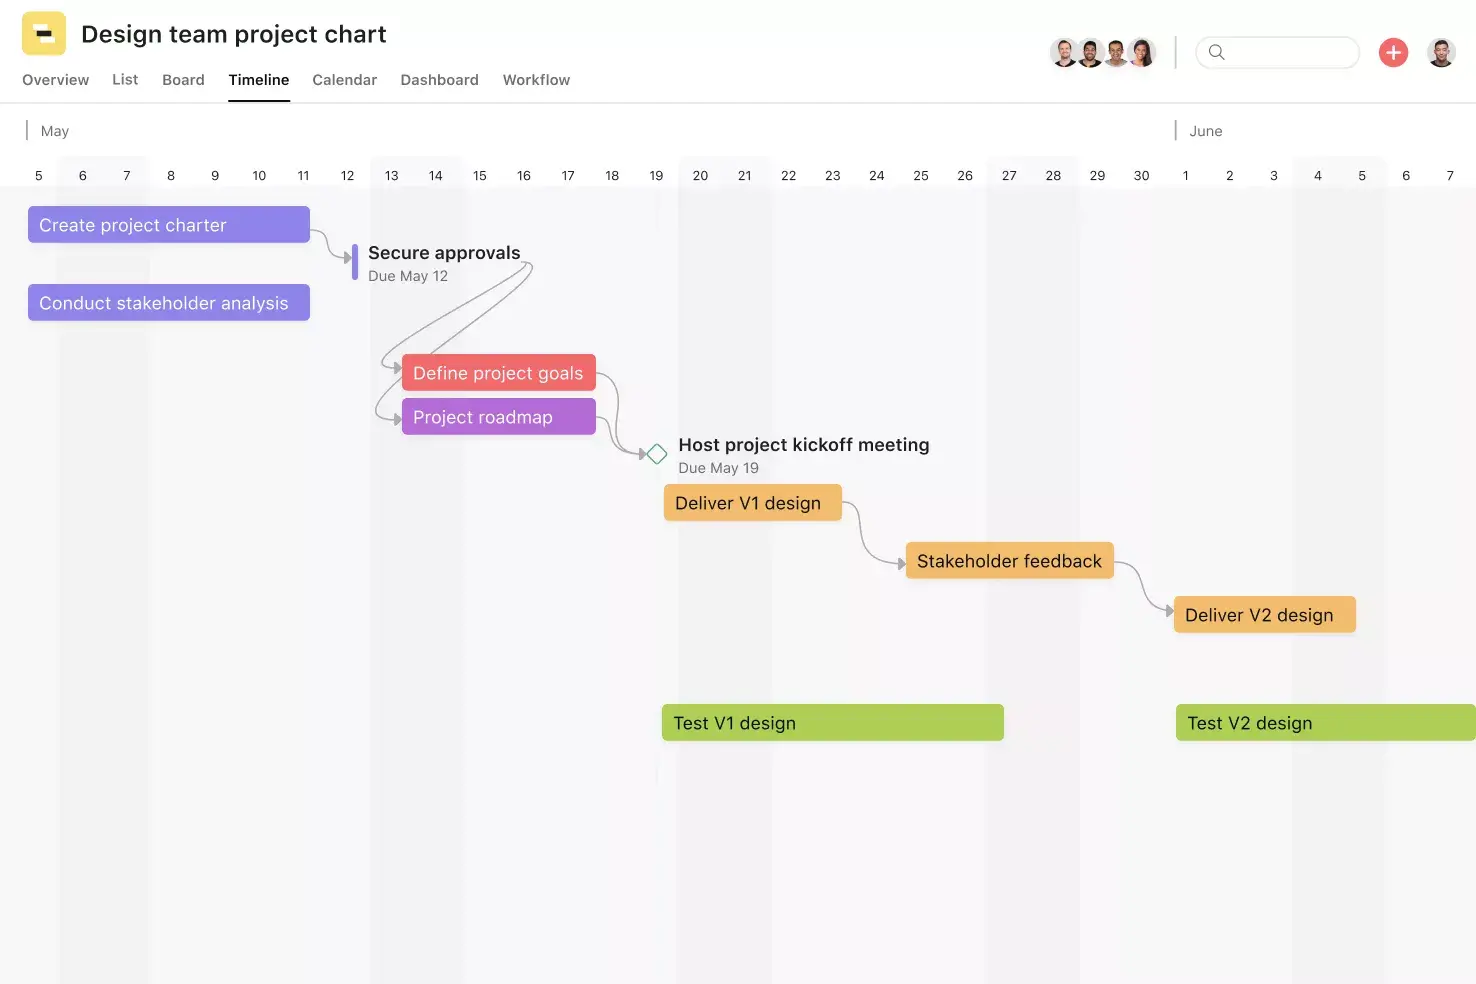
Basic project chart template: Use a Gantt-style project chart template to track project phases and tasks across project types, from software development to marketing campaigns.
Construction project template: Use a construction project plan template to visualize each step in your construction process.
Agile project plan template: Typically organized as a Gantt chart, these reusable templates let you customize and use a plan for your future Agile projects.
Critical path template: Critical path templates help you identify the tasks you must complete to keep the project on track and finish on time. With a critical path template, you can view upcoming project tasks and deliverables in a Gantt-style illustration, so you can quickly see what's coming up and any potential blockers.
How to choose the right Gantt chart template
Start with the question your stakeholders ask most often, then pick the template built to answer it.
Where are we overall? Start with a basic project chart template to track phases, owners, and dates.
What can't slip? Use a critical path template to see which tasks drive your end date.
Are we working in Are we working in sprints? An Agile project plan template integrates iterations and releases on one timeline.
Do you need a high-level view for leaders? A project timeline template shows phases and milestones without task-level detail.
Whichever template you choose, keep only the fields your project depends on. A lean Gantt chart is easier to keep up to date.
Integrated features
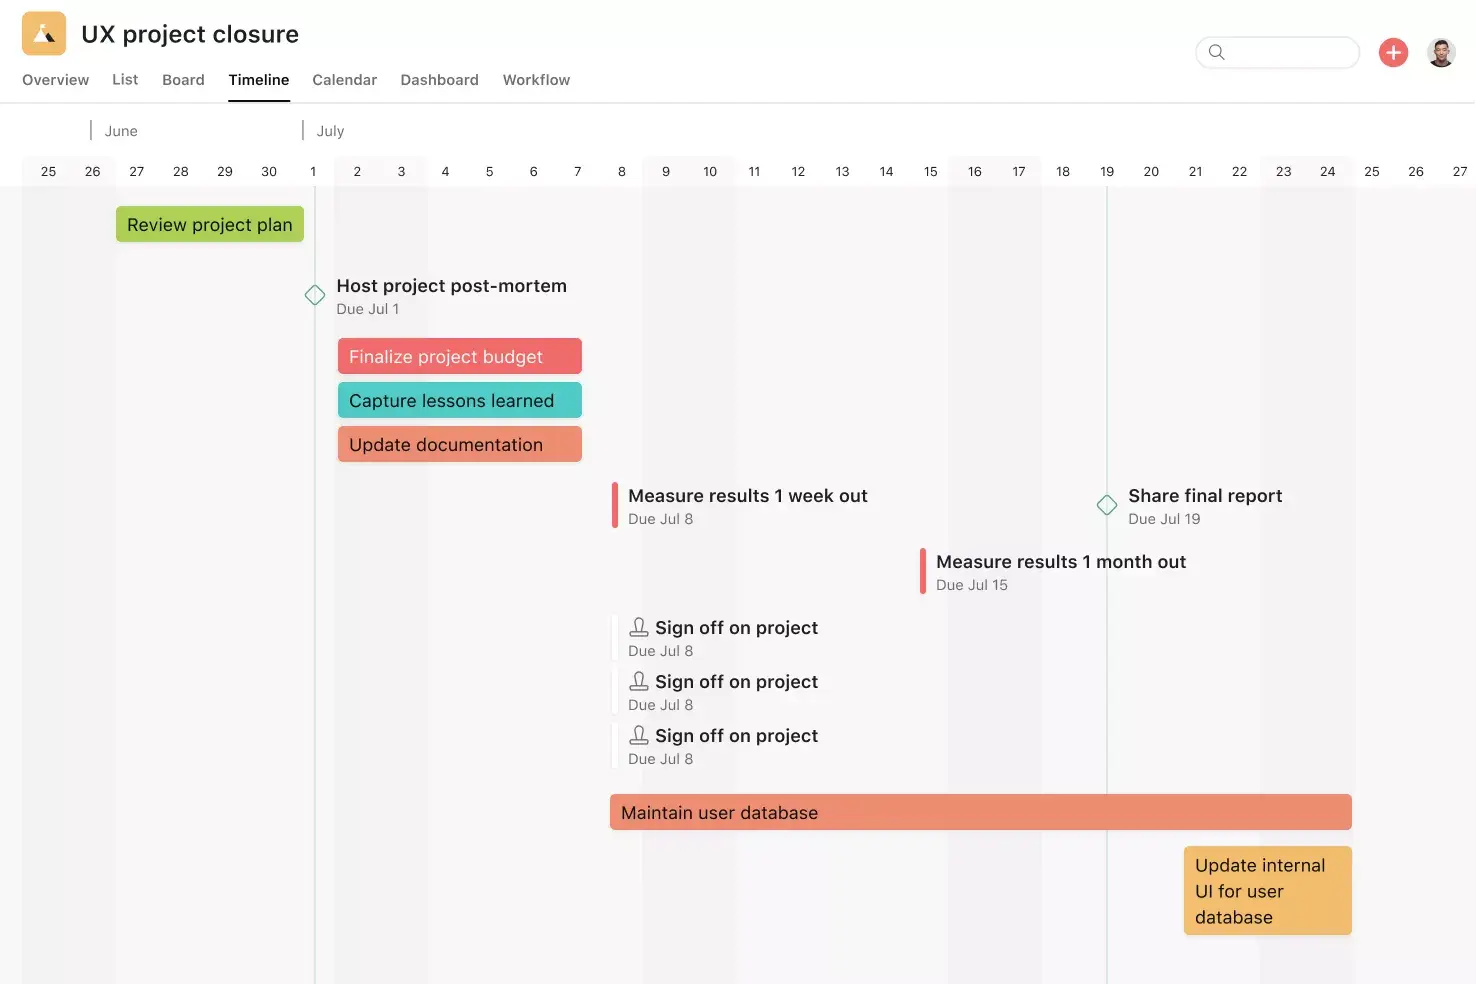
Timeline View. A Gantt-style project view that displays all of your tasks in a horizontal bar chart with start dates, end dates, and dependencies. See how the pieces of your plan fit together and identify dependency conflicts before they start.
Subtasks. Break larger tasks into smaller, actionable components while keeping them connected to the parent task. Subtasks are ideal when a task has multiple contributors, review steps, or a broad due date.
Milestones. Milestones represent important project checkpoints. By setting milestones throughout your project, you can show team members and project stakeholders how you're pacing towards your goal.
Dependencies. Mark a task as waiting on another task so your team knows the work order. When a dependent task is completed or rescheduled, Asana automatically notifies the next assignee.
Recommended apps
Google Drive. Attach files directly to tasks in Asana using the Google Workspace file picker, built into the Asana task pane. Easily attach any My Drive file with just a few clicks.
OneDrive. Attach files directly to tasks in Asana using the Microsoft OneDrive file chooser, built into the Asana task pane. Easily attach any My Drive file with just a few clicks.
Everhour. With the Everhour + Asana integration, you can add Asana tasks as time blocks in your Google Calendar. The integration lets you set task duration and timing, and choose whether Everhour can automatically reschedule them.
Get started with a Gantt chart template
A Gantt chart template makes project planning easier by giving you a clear timeline from the beginning. Whether you need to manage task dependencies, keep your team on schedule, or see how everything fits together for event planning, a template helps you work faster and stay organized. Ready to see it in action? Get started with Asana and build your Gantt chart in Timeline or Gantt view, available on Starter, Advanced, Enterprise, and Enterprise+ plans.
Use a Gantt chart templateFAQs about Gantt chart templates
Create a Gantt chart template in a flexible tool, like project management software, so you can update and change it as needed. Start by brainstorming the use case, gathering necessary information, entering details, and using relevant integrations and apps to connect your project tech stack.
Yes, Asana offers a ready-made Gantt chart template to plan your project schedule. Customize task owners, dates, and dependencies, then use Timeline view to see which tasks overlap and which must finish before others can start.
A Gantt chart template is a reusable project timeline that displays tasks, assigned roles, dependencies, and deadlines in a color-coded bar chart, so you can plan and track projects without building a new chart from scratch.
Gantt chart templates are ideal for project managers and team leads who want a visual, big-picture view of their project timeline. They work best for tracking tasks, deadlines, and dependencies at a high level, not granular day-to-day details.
Excel doesn't include a built-in Gantt chart type, but you can create a basic one by customizing a stacked bar chart. For more flexibility, a project management tool like Asana lets you build Gantt-style timelines that update automatically as tasks and deadlines change.
Yes, AI tools like ChatGPT can draft a task list, suggest durations, and outline dependencies from a project description. In Asana, AI Teammates and AI Connectors work from your real project data, so suggested dates and owners reflect actual work. Every agent has identity, permissions, audit trails, and spend controls, and your team reviews and approves the plan before it goes live.
Timeline and Gantt views are included in Asana's Starter, Advanced, Enterprise, and Enterprise+ plans. They aren't part of the Personal plan. With either view, you can map tasks on a timeline, connect dependencies, set milestones, and adjust dates as plans change, so your whole team works from one up-to-date schedule.
Related templates


Create templates with Asana
Learn how to create a customizable template in Asana. Get started today.