Workflow diagram: Symbols, types, and how to create


Summary
When it comes to managing work, visualizing tasks and keeping team members connected via different communication styles is key. That's where a workflow diagram comes in.
A workflow diagram can help prevent project deviations and bottlenecks by clearly communicating goals and deadlines visually. Whether you use a workflow diagram when onboarding new hires or to streamline use cases and testimonials, it's a great way to visualize tasks and data flows.
This article explains what a workflow diagram is, its benefits, common symbols and parts, the types you can use, and how to make one step by step.
What is a workflow diagram?
A workflow diagram is a visual representation of a business process that shows the sequence of tasks, decisions, and handoffs from start to finish. Also known as a workflow chart, it helps teams map out complex projects after the initial research and project planning stages. The result is a clear view of high-level tasks, dependencies, and project timeline objectives.
Workflow diagram compared to other process mapping
Workflow diagrams are similar to other UML (Unified Modeling Language) diagrams, which are a standard way to show and document software systems. However, workflow diagrams differ slightly from other process maps and UML diagrams. Here’s a quick comparison:
Diagram type | Primary focus | How it differs from a workflow diagram |
Business process map | Detailed process steps | Outlines steps in detail; a workflow diagram gives a high-level visual representation |
Process flowchart | Any process or decision path | A broader category; a workflow diagram is one specific type of flowchart |
Activity diagram | Technical system activities | Translates backend functions into visuals; a workflow diagram tracks business tasks |
Data flow diagram | Data movement through a system | Follows data (metrics, results); a workflow diagram follows the work itself |
Below, we break down each comparison in more detail.
Leia: Diagrama de fluxo de trabalho: símbolos, usos e exemplosBusiness process mapping
Workflow diagrams are closely related to business process mapping. The difference between the two is that a process map typically outlines steps in detail, while a workflow diagram provides a visual representation of those steps. The objective of a workflow diagram is to help team members understand their tasks, objectives, and roles and responsibilities within the project at a high level.
Process flowcharts
Workflows and flowcharts are often confused. While the two terms sound similar, a workflow is just one type of flowchart. You can also use flowcharts to visualize other processes, like PERT charts and process documentation.
Activity diagrams
Activity diagrams are another type of flowchart that outlines the sequence of activities within a system. They translate complex backend functions into easy-to-understand visuals, making technical processes accessible to any stakeholder. For example, in Asana, you could draw an activity diagram to create a project as follows:
User clicks the button to create a project
New project launched
User customizes the project with different names and features
User saves the project and updates when needed
Data flow diagrams
Data flow diagrams track how data moves through a system or process, while workflow diagrams focus on the work being done. In a data flow diagram, you show metrics, results, or other data points instead of actions.
Ler: 4 tipos de mapas conceituais (com modelos gratuitos)Benefits of workflow diagrams
Workflow diagrams are more than just visuals. They offer real benefits that help your team plan, communicate, and get work done better.
Improved clarity and communication: Workflow diagrams give every team member a shared visual reference, making it easier to understand who's responsible for what and how tasks connect. This reduces miscommunication and keeps everyone aligned.
Faster identification of bottlenecks: By mapping out each step visually, you can spot inefficiencies, redundant tasks, or handoff delays that might otherwise go unnoticed in a text-based plan.
Better project management: Workflow diagrams give project managers a big-picture view, making it easier to track progress, manage dependencies, and keep the project on schedule.
Stronger process documentation: A workflow diagram acts as a living document that shows how a process works. It helps with onboarding new team members, reviewing current workflows, and maintaining consistent projects.
Support for workflow automation: When you can clearly see each step in a process, it becomes much easier to identify tasks that can be automated, helping your team spend less time on repetitive, manual work.
Whether you’re improving one team’s process or coordinating several departments, a workflow diagram helps you move from planning to action with confidence. If your team needs more than a static diagram, compare tools in our guide to the best workflow management software for managing, automating, and tracking workflows.
When to use a workflow diagram
A workflow diagram is a visual representation of a process, whether a new one you're creating or an existing one you're altering. For example:
A process to streamline your e-commerce customer journey.
A project to increase customer retention and satisfaction.
A process to automate and optimize manual tasks involving customer data.
A workflow diagram comes between the business process map (which you'll create before the project starts) and business process automation (which you'll use to optimize and streamline processes). Your map provides the detailed process steps that stakeholders need to begin work. A workflow diagram, on the other hand, helps clarify overarching goals during the process.
The components of a workflow diagram
To understand how a workflow diagram works, you first need to understand the components that make up a workflow. These include inputs, outputs, and transformations, which all help to communicate deliverables in as little time as possible.
Once you know these parts, you’ll be able to read a workflow diagram and make your own. The main components are:
Inputs: An action that affects the following step
Transformations: An input change
Outputs: The outcome after the transformation
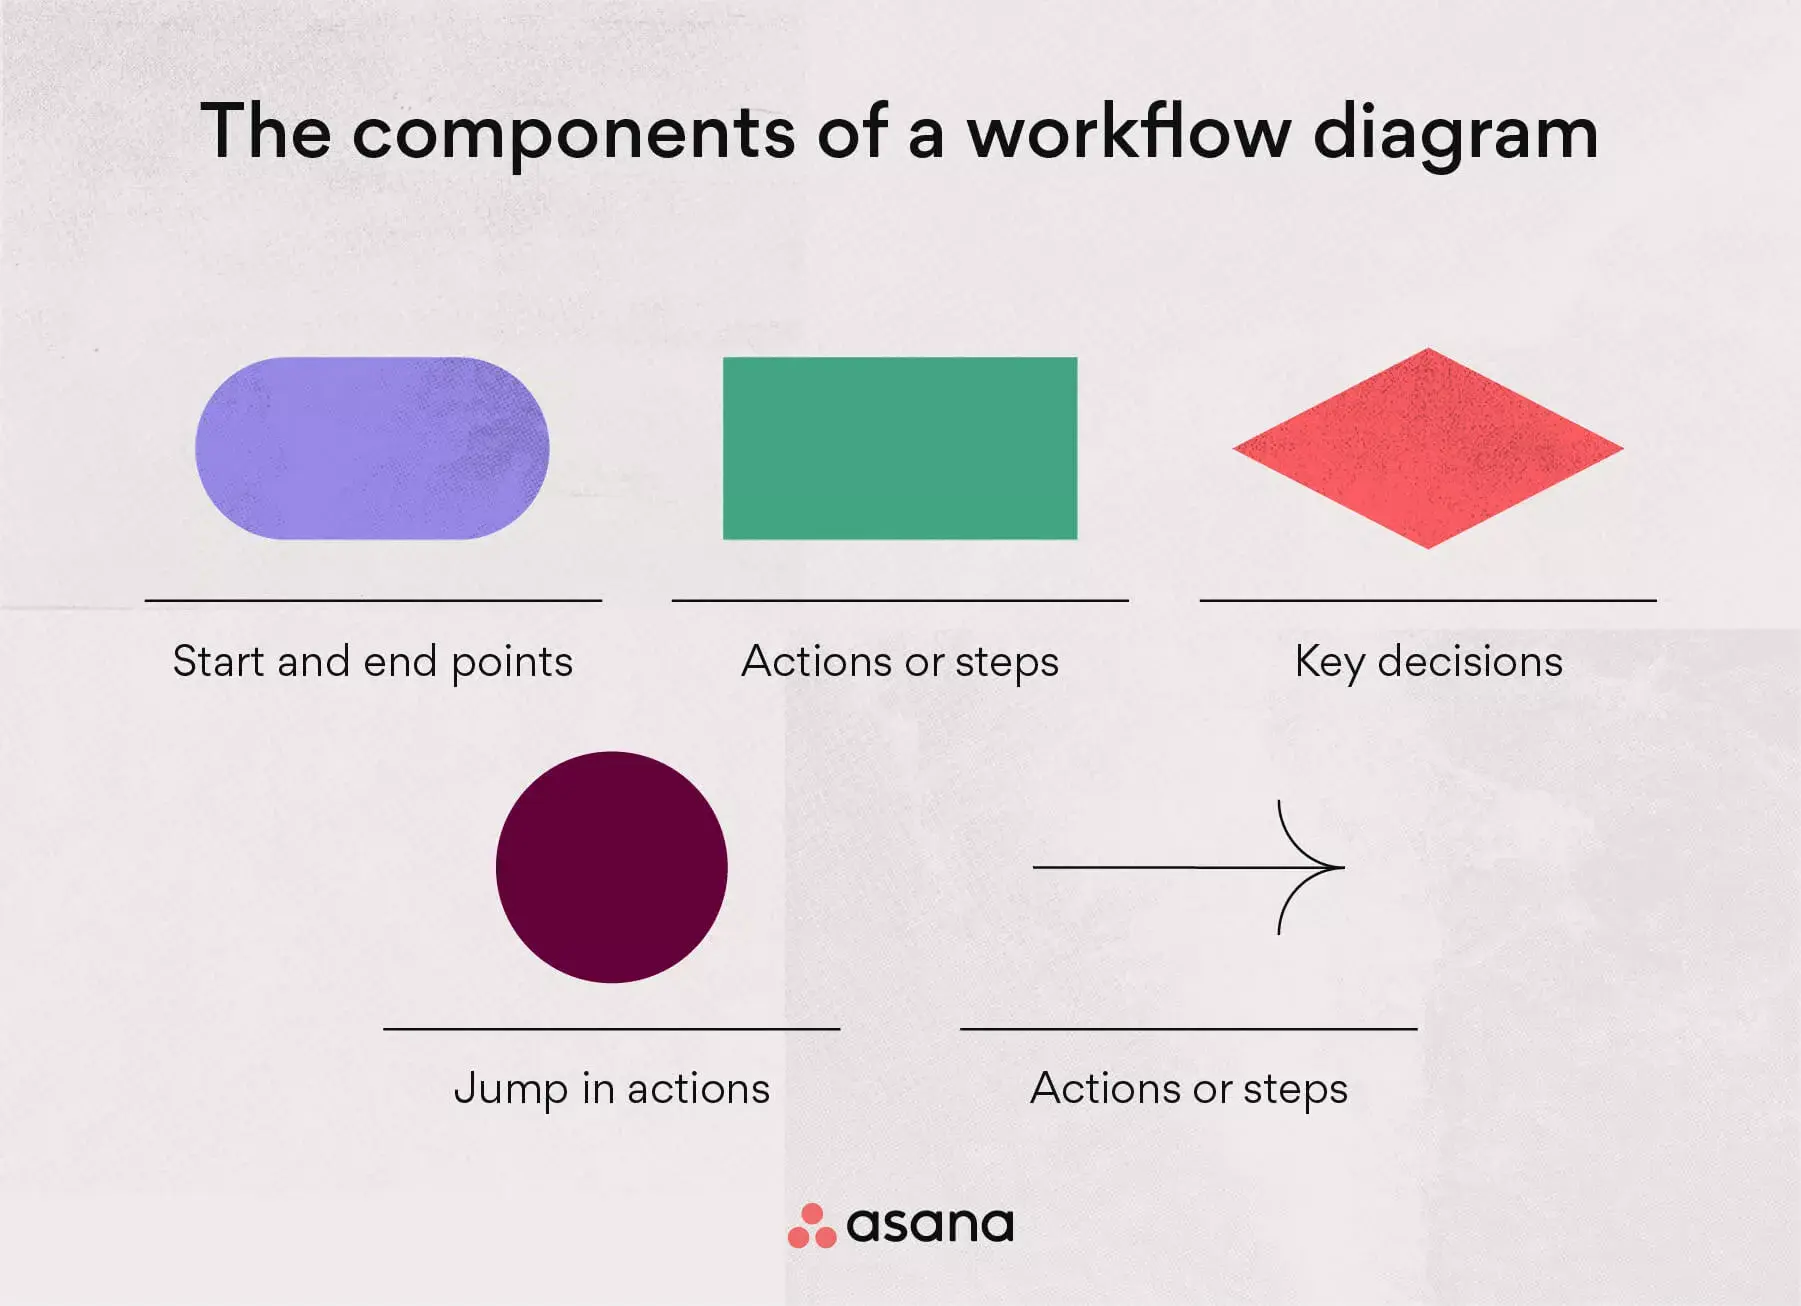
These components are visualized by shapes and arrows, including:
Ovals: Represent the start and end points of a process.
Rectangles: Represent instructions about actions and steps.
Diamonds: Represent key decisions during the process build.
Circles: Represent a jump in actions and may indicate steps to bypass (in certain situations).
Arrows: Connectors that represent the dependency between all shapes and actions.
Together, these parts guide the reader to follow the right steps and reach the goal.
Types of workflow diagrams
There are several types of workflow diagrams, each with its own benefits. The best choice depends on how complex your process is and what your team needs.
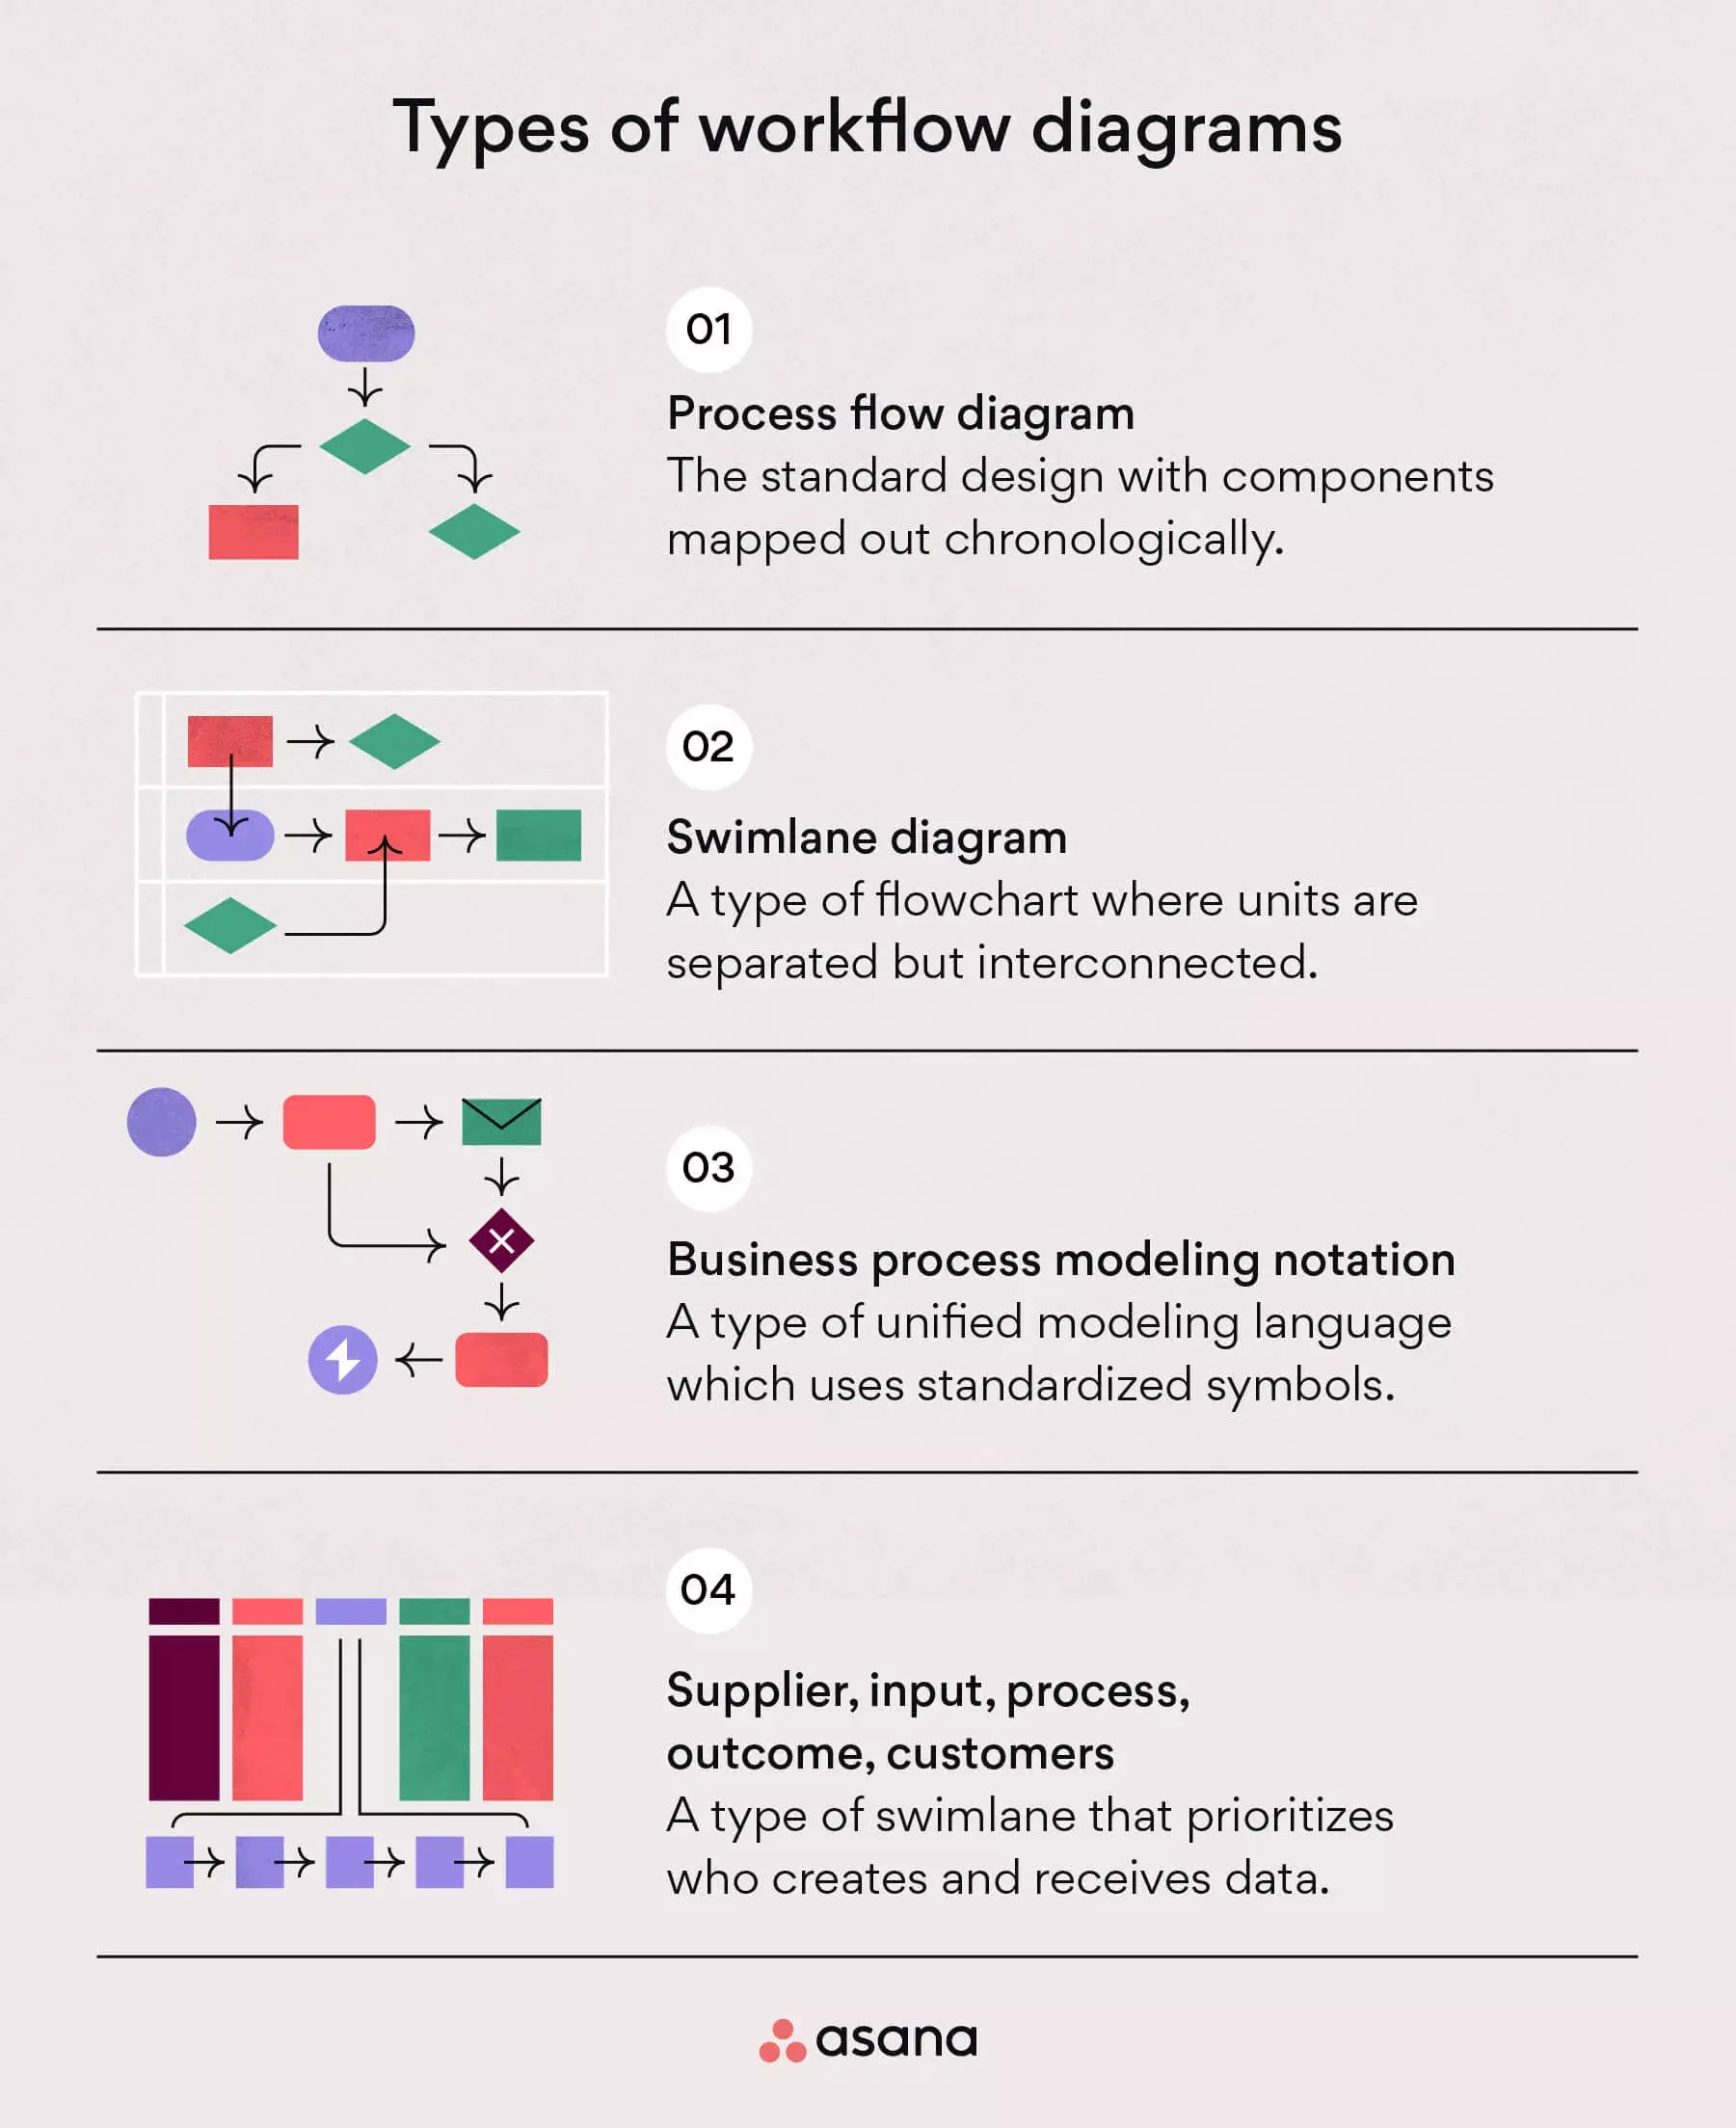
From process flows to swimlanes, here are the four different types of workflow diagrams you can use for your workflow analysis.
Leia: 3 layouts de gestão visual de projetos (e como usá-los)1. Process flow diagram
A process flow diagram tool is the standard for workflow design. In this diagram, all components are mapped out chronologically, making it a basic visual representation of a process. This type of diagram provides a general overview of individual tasks and objectives without getting into too much detail.
Best for: Teams who want a simple, high-level view of a new process that anyone can quickly understand.
2. Swimlane diagram
A swimlane diagram is another popular way to show workflows, but it’s different from a process flow diagram. It breaks the workflow into smaller sections or units. These sections are connected but separated to show how they interact and where there might be problems.
Best for: Teams handling complex processes with many connected but separate parts.
3. Business process modeling notation (BPMN) diagram
BPMN uses standard symbols that both business and technical team members can easily understand. It is a type of Unified Modeling Language that shows different steps using these symbols.
BPMN diagrams focus on how information is received and understood inside a company. That’s why they are mostly used for internal process changes that don’t affect customers.
Best for: Teams working to improve processes across departments.
4. Supplier, input, process, output, customers (SIPOC) diagram
SIPOC is a type of swimlane diagram that examines several parts of a workflow.
Unlike regular diagrams that show steps in order, a SIPOC diagram highlights who creates and receives data. It looks at how data is received both inside and outside the company, making it useful for processes that affect customer experience.
Best for: Teams who want to focus on how data is received both inside and outside the company.
Read: What is a SIPOC diagram? 7 steps to map and understand business processesHow to create a workflow diagram (with example)
To make a workflow diagram, start by gathering the main parts of your process. This includes your inputs, outputs, transformations, and main deliverables.
Show these parts on your diagram using arrows, circles, rectangles, ovals, and diamonds to represent each point.
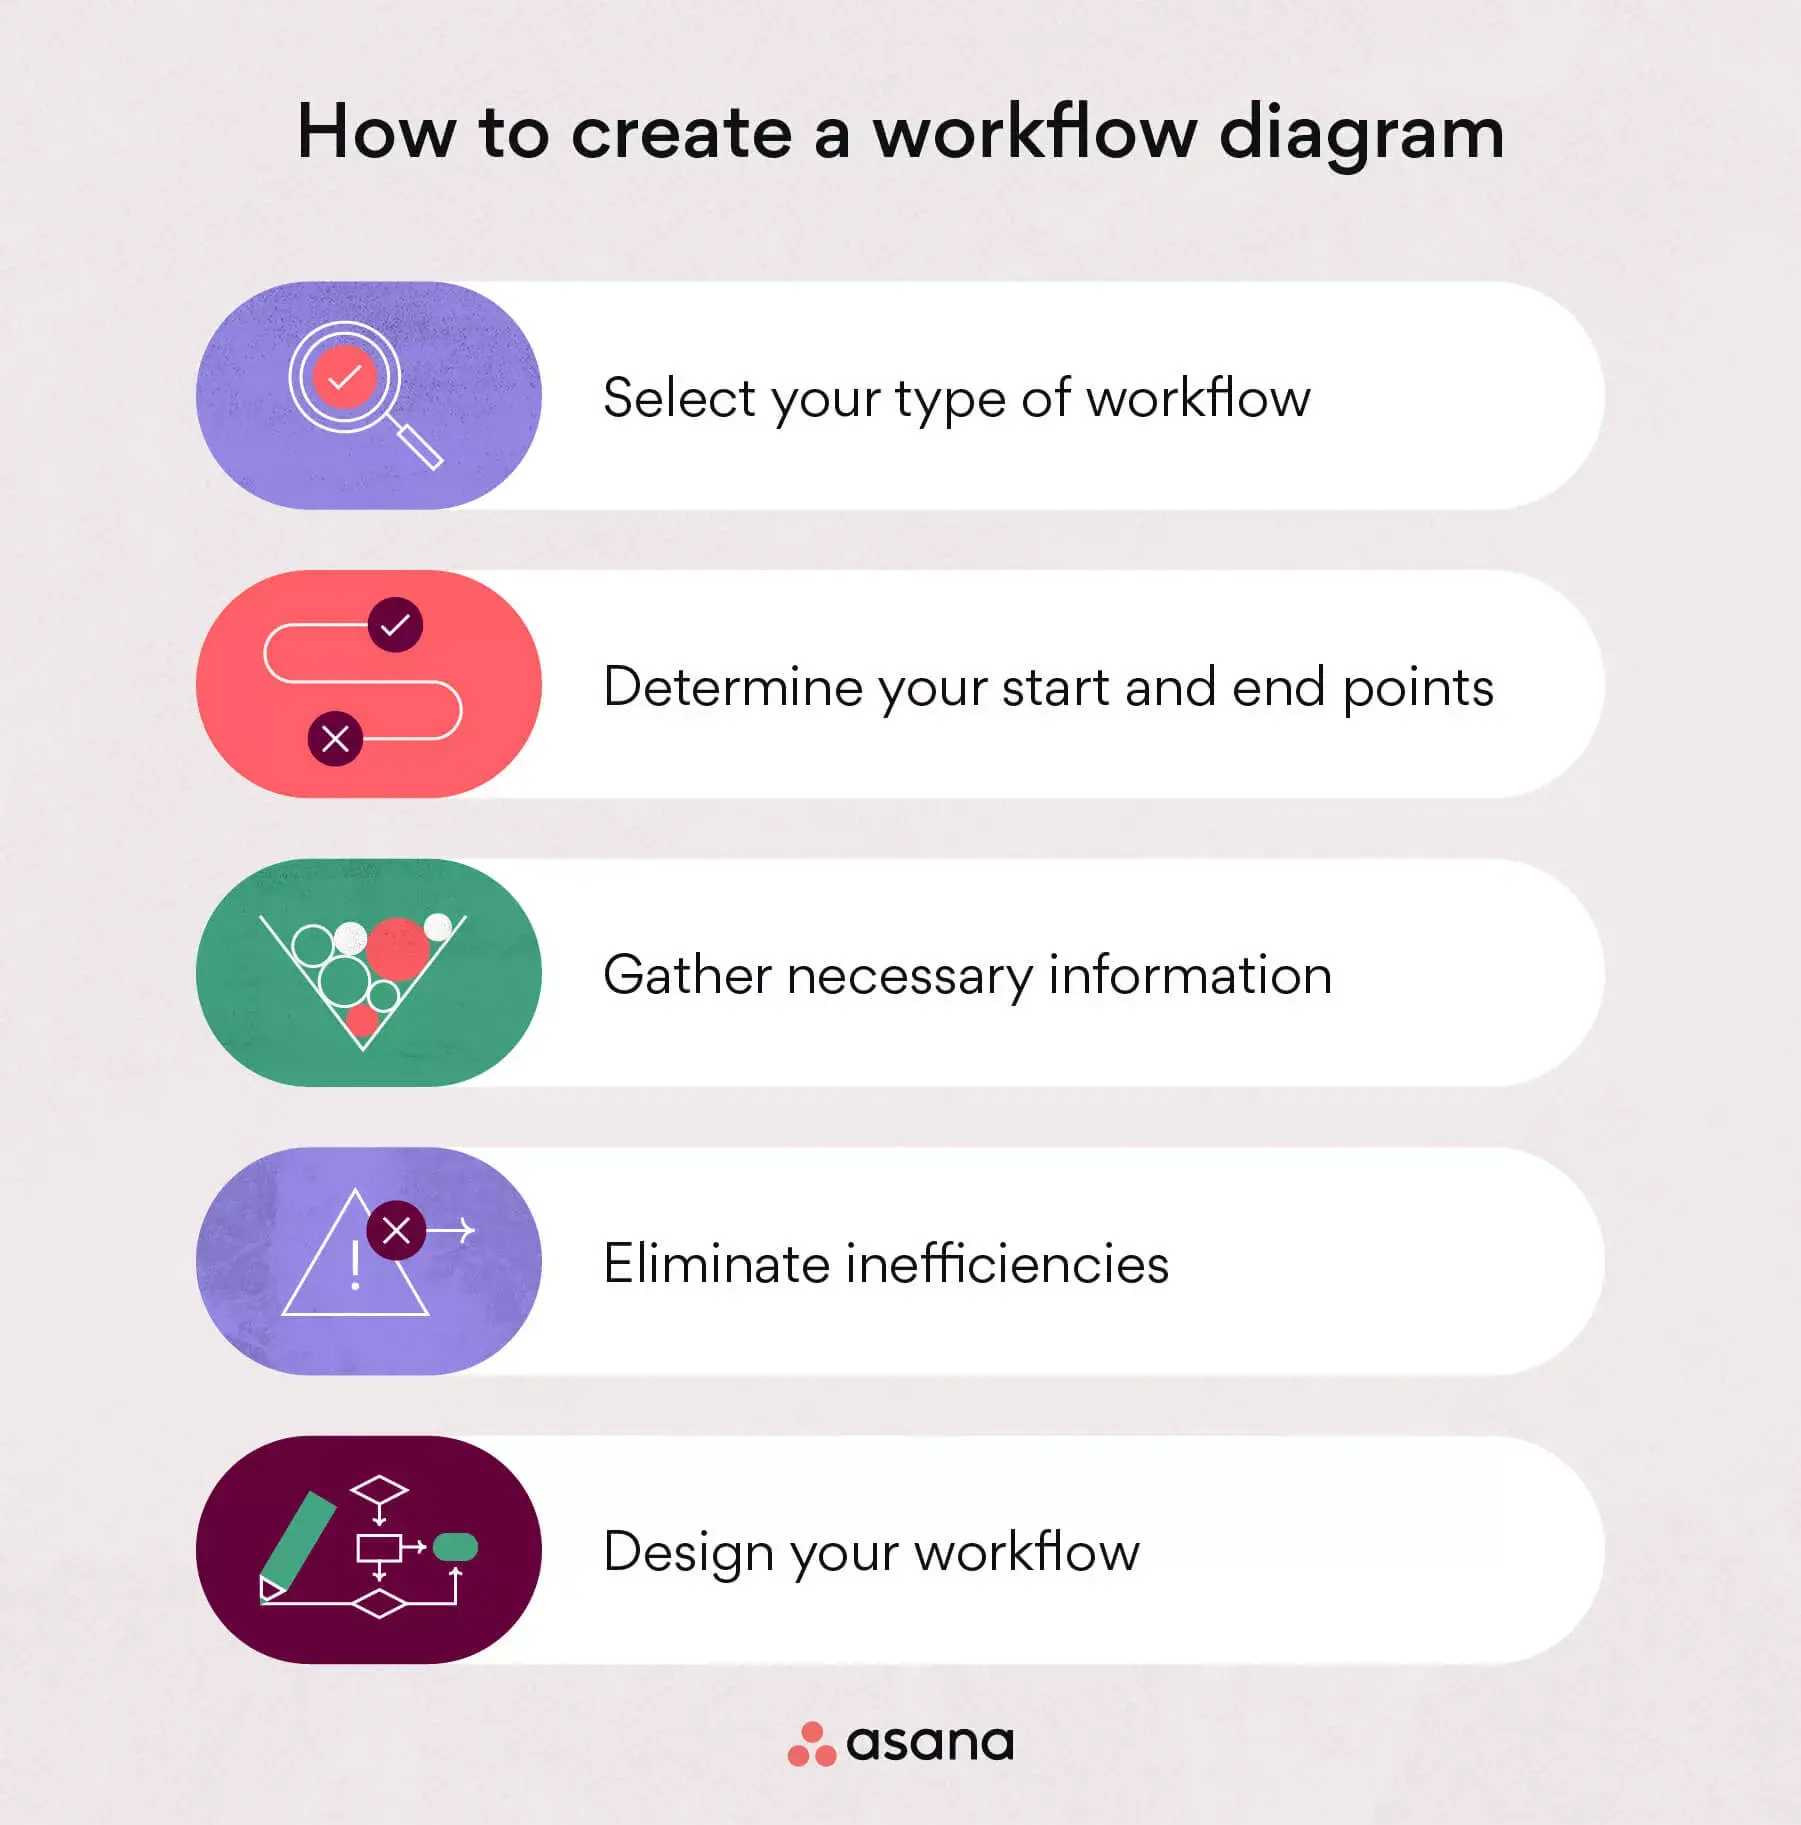
1. Select your type of workflow
To choose the best workflow type, think about what your process needs. If it’s complex with many people involved, a swimlane diagram might work best. If it’s simple, a basic process flow diagram could be enough. You can change your workflow later, but it’s easier to pick the type at the start. This helps you know how complex or simple your workflow will be.
2. Determine your start and end points
Next, figure out where your workflow starts and ends. On your diagram, these are shown as ovals. To find these points, think about when your process begins and ends. What action starts it? What step finishes it?
3. Gather necessary information
To gather information, connect with stakeholders to understand each piece of the process. This may include a kickoff meeting with various departments and leaders to gather the details and approvals needed to begin constructing your workflow diagram.
Every process is different, so the information you need will change too. Think about the steps needed to finish the process, who will be involved, and any other important details for your readers.
4. Eliminate inefficiencies
The final step before constructing your visual workflow is to consider and eliminate any inefficiencies that may arise. The specific inefficiencies will vary, but they may include a lack of resources, issues with product development, or other obstacles that arise during the process.
Document these inefficiencies in a change log under your change control process. This way, you will be able to communicate these problems to stakeholders, prioritize inefficiencies, and track whether they've been resolved.
5. Design your workflow
Finally, start building your workflow by adding your information, data points, and improvements to the diagram type you picked earlier. Every process and diagram is different, so yours will be unique. Here’s an example of what a workflow diagram could look like:
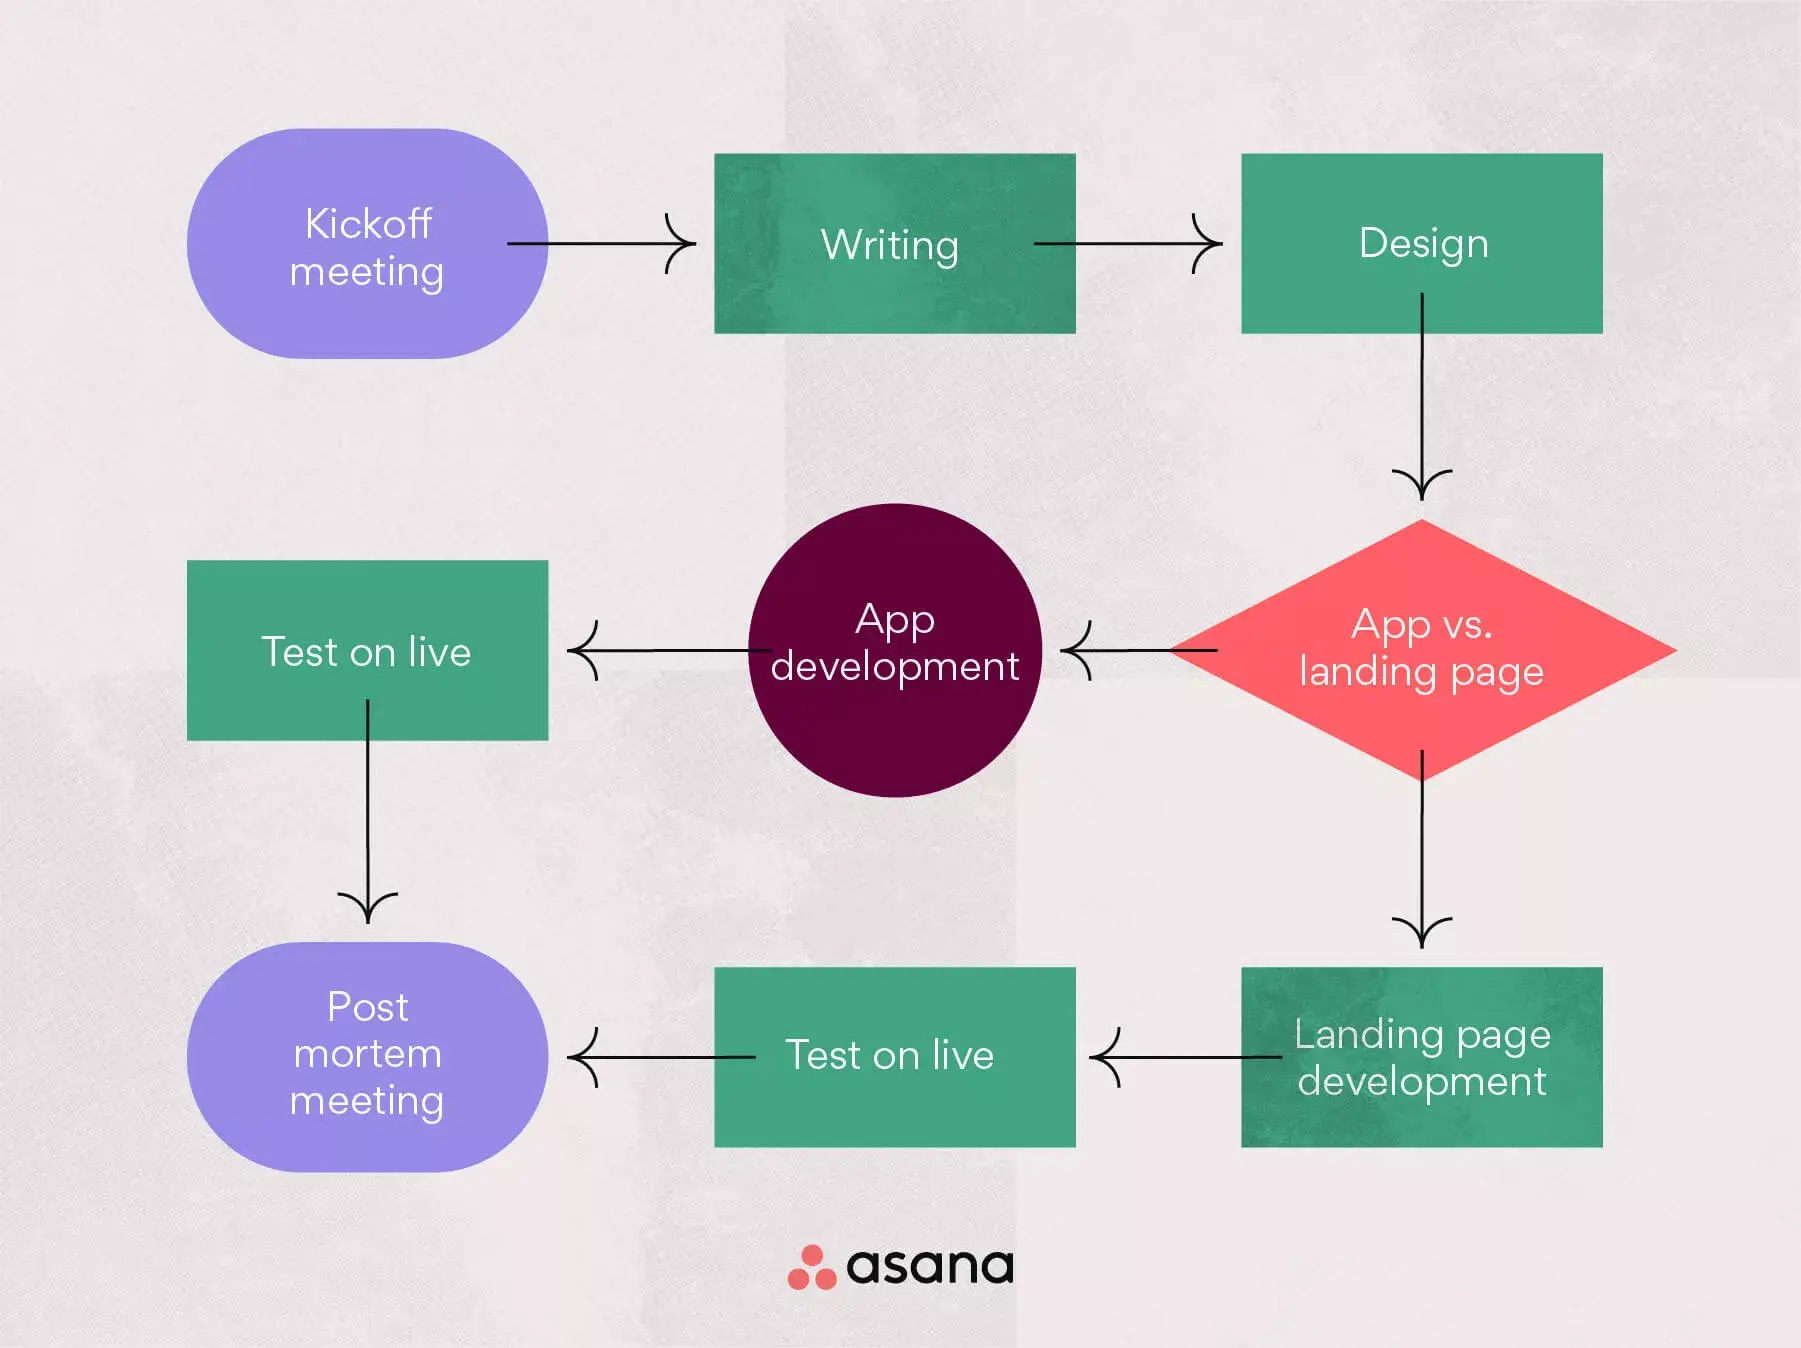
After you design your workflow, go over it with your stakeholders to make sure it’s correct and fits the situation. This helps you check that all problems are addressed and resources are set up properly.
Use workflows to map out processes
Showing workflows visually helps you explain deliverables to stakeholders and leaders. It also makes it easier for different departments to work together on the same process.
To take your workflows to the next level, try workflow management software. From task automation to streamlined communication, Asana can help your team plan, track, and manage work in one place. Get started today.
Visualize e monte fluxos de trabalho com a Asana