


Align strategy to execution, at every level
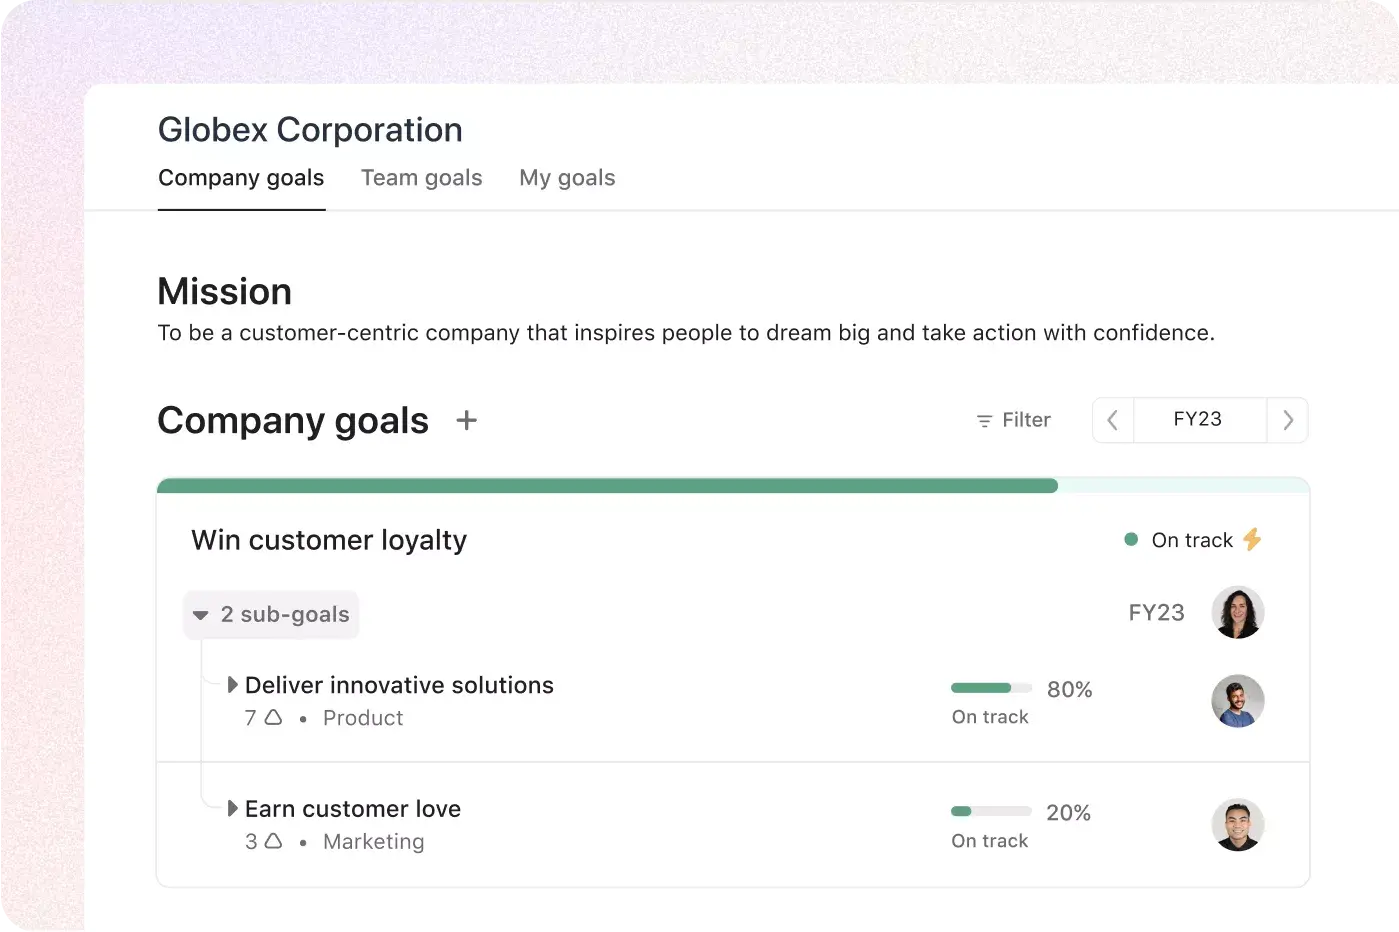
Track goals and the work that supports them, all in one place. See how every initiative furthers company objectives, so teams stay focused on what matters.
Stay on target with these features
Keep teams aligned to company priorities, so everyone is headed in the right direction. With shared goals and real-time data, you can index on results and course-correct when needed.
Agentic project management
Where humans and agents run critical workflows together, from a shared plan, toward the same goals.
App integrations
Sync data across tools
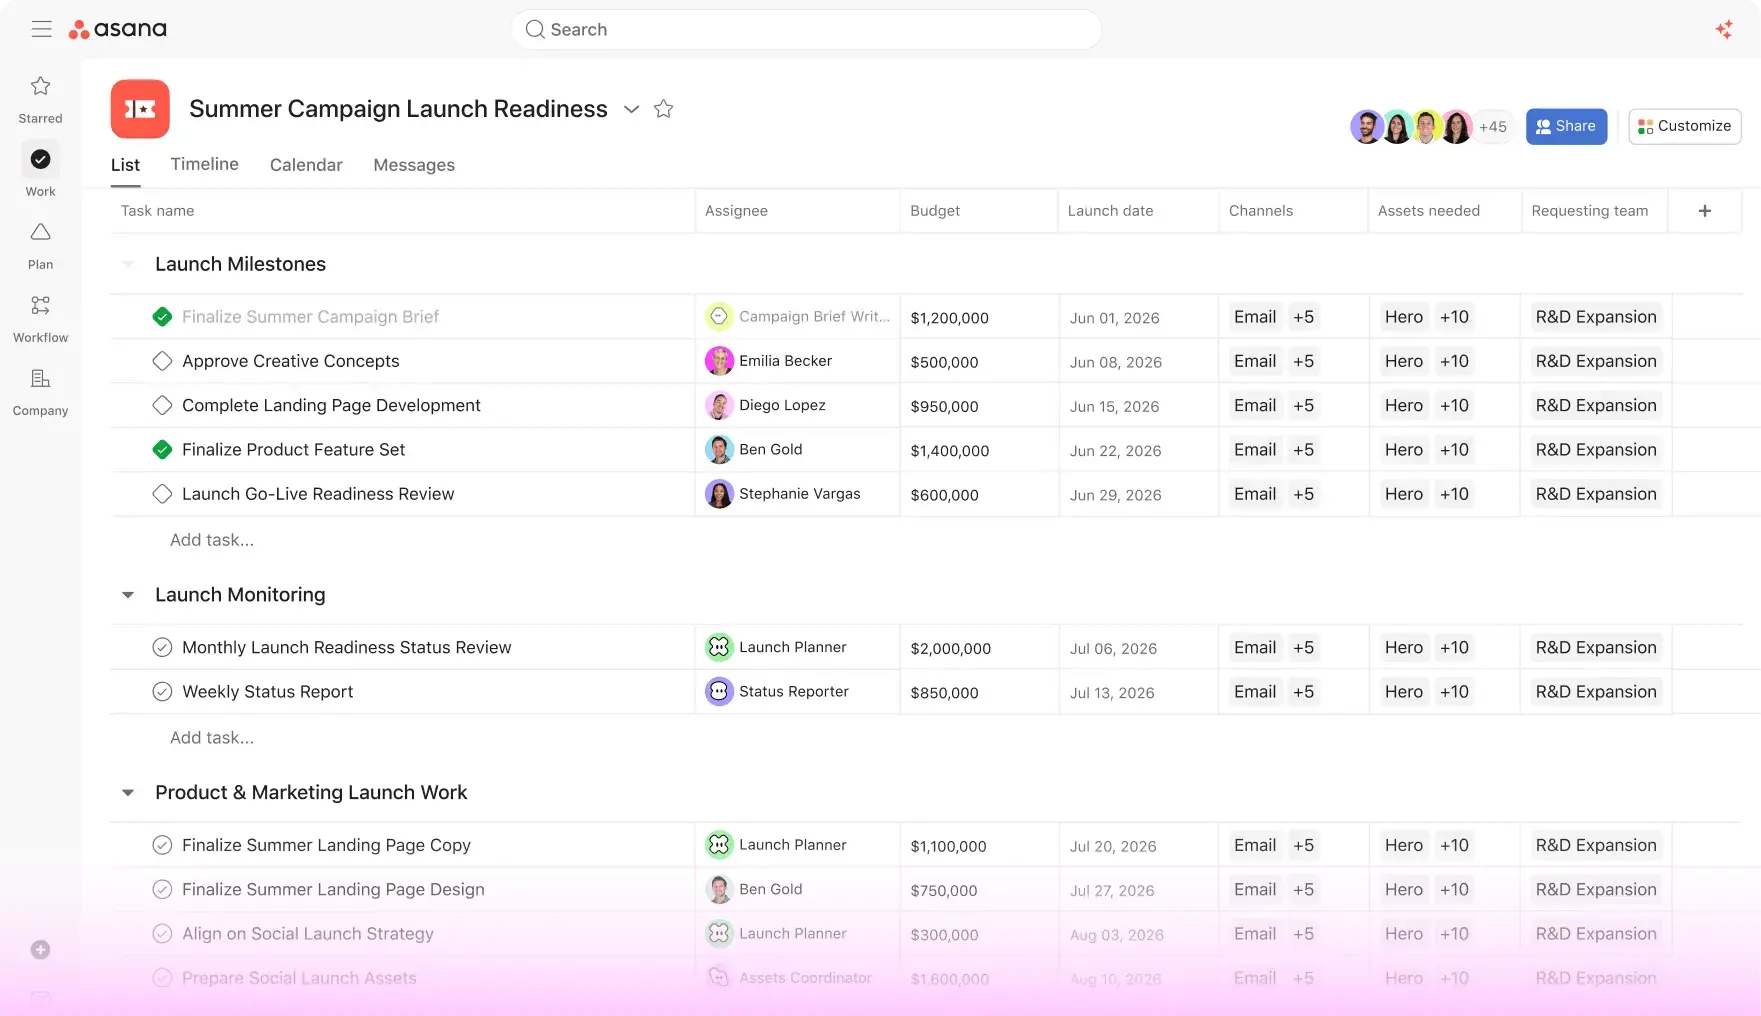
No more back-and-forth. Asana integrates with 270+ apps, so the information you need is always at your fingertips.



Anatomy of Work Global Index
87% of workers with clear, connected goals say their organization is well-prepared to meet customer expectations—more than double those without.


Company Size
Enterprise
Industry
Technology
At a large enterprise company like Xero, communicating goals can be tough. Instead of tracking objectives in hard-to-find spreadsheets, Xero uses Asana to monitor and share goals across their global team. This lets everyone see how each regional priority ladders up into their overarching strategy.
Tony Ward
President, The Americas, Xero
Go deeper
Goals and reporting are just the start. See what else you can do with Asana.
Still have questions? We have answers.
Goals & Reporting in Asana is a unified capability set that lets you connect work to company objectives, track progress, monitor performance via real-time dashboards, reporting tools, and portfolios.
The Asana plans that include access to Goals & Reporting are Advanced+ plans for Goals, while Reporting is available on Starter+ plans.
Goals connect to projects and tasks by allowing you to link a goal to supporting projects, portfolios, or tasks, and Asana will update goal progress automatically based on that work.
You can set private versus public Goals in Asana. Goals can be shared with your entire organization or restricted to specific team members, allowing for public or private visibility.
Portfolios in Asana are tools that let you group multiple projects to monitor health and metrics across them with dashboards, custom charts, status updates, and workload views.
The plans that include Portfolios are Advanced, Enterprise, and Enterprise Plus plans.
Portfolios can contain other portfolios in Asana. You can nest portfolios so that portfolios can include other portfolios as well as projects.
Portfolio status updates are features that let you share performance summaries across projects in a portfolio using a built-in status builder.
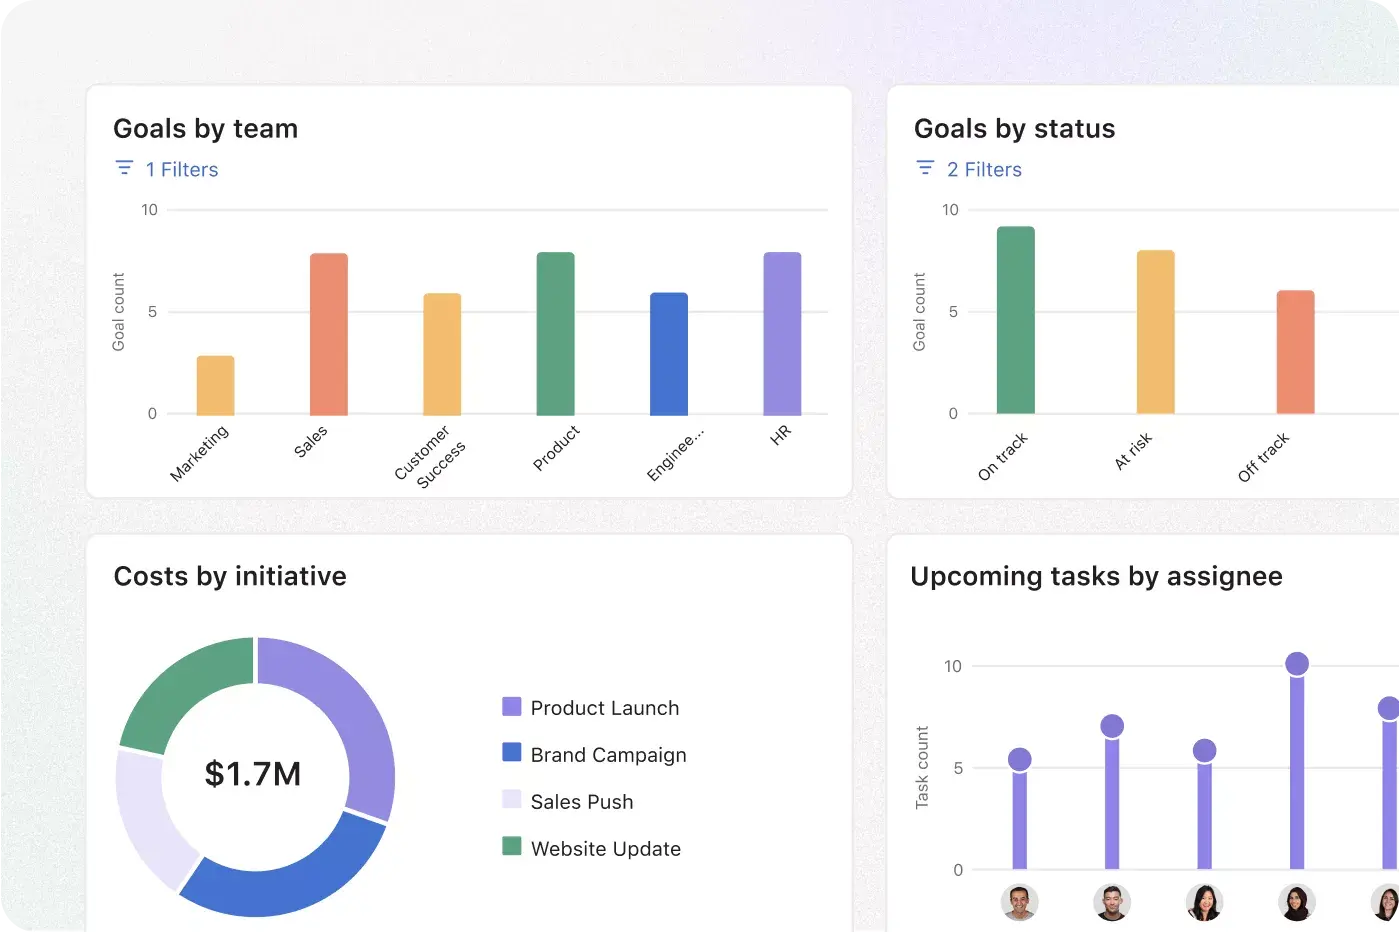
Reporting dashboards in Asana are tools that let you visualize team and organizational data in real time using charts built from projects, portfolios, goals, or tasks.
The chart types available in dashboards include column, line, burnup, donut, number, and lollipop charts.
You can customize and share reporting dashboards in Asana. You can build custom charts, apply filters, and share dashboards with view-only access. You can also export dashboards to PDF or PPT.
Transform the way you work with Asana
Start your free trial
Try Asana for free. No credit card required.
Watch the demo
See how Asana connects companies at scale.
Speak with a sales rep
Learn how Asana helps teams collaborate seamlessly.