PERT chart: Definition, Examples & How to Make One


Summary
If you've ever struggled with mapping project tasks or keeping track of dependencies, we have the perfect solution for you. A PERT chart, also known as a PERT diagram, is a tool used to schedule, organize, and map out tasks within a project.
PERT stands for program evaluation and review technique. It provides a visual representation of a project's timeline and breaks down individual tasks. These charts are similar to Gantt charts, but structured differently. This diagram shows the steps to move from a project start date to an end date. In this article, we'll cover the five steps, show you an example, and explain how to effectively use a PERT chart to your advantage.
Master AI-Powered Workflow Optimization
Ready to revolutionize your team's productivity with AI you can trust? Join industry leaders from Asana and Anthropic to learn proven strategies for implementing AI across your workflow stages and unlock the full potential of Asana's AI Studio.
How a PERT chart works
A PERT chart maps project tasks as nodes and connects them with arrows to show dependencies. This visual approach helps project managers create realistic schedules, estimate timelines, and communicate plans to stakeholders before work begins.
Creating a project roadmap, such as a PERT chart, can help you accomplish several project planning activities, including:
Getting schedule and timeline signoff from leadership
Communicating project objectives to stakeholders
Visually mapping out a complex project and its interdependencies
Estimating the time needed to complete individual tasks
To make the most of your PERT chart, first understand the steps needed to complete one and how to visually map out your diagram.
History and origin of PERT charts
The Program Evaluation and Review Technique, or PERT, was developed in the late 1950s by the U.S. Navy to manage the complex Polaris missile project. Its goal was to simplify planning and scheduling for large-scale initiatives with many moving parts.
PERT was created alongside the Critical Path Method (CPM) and shares a similar focus on mapping task dependencies. While originally drawn by hand, today's PERT charts are created with software, making them a valuable tool for modern teams managing complex work with uncertain timelines.
How to make a PERT chart
If you want to stay ahead of deadlines, creating a PERT chart is the way to go. This guide will walk you through creating a PERT chart step-by-step, so you can visualize every task, dependency, and deadline with ease.
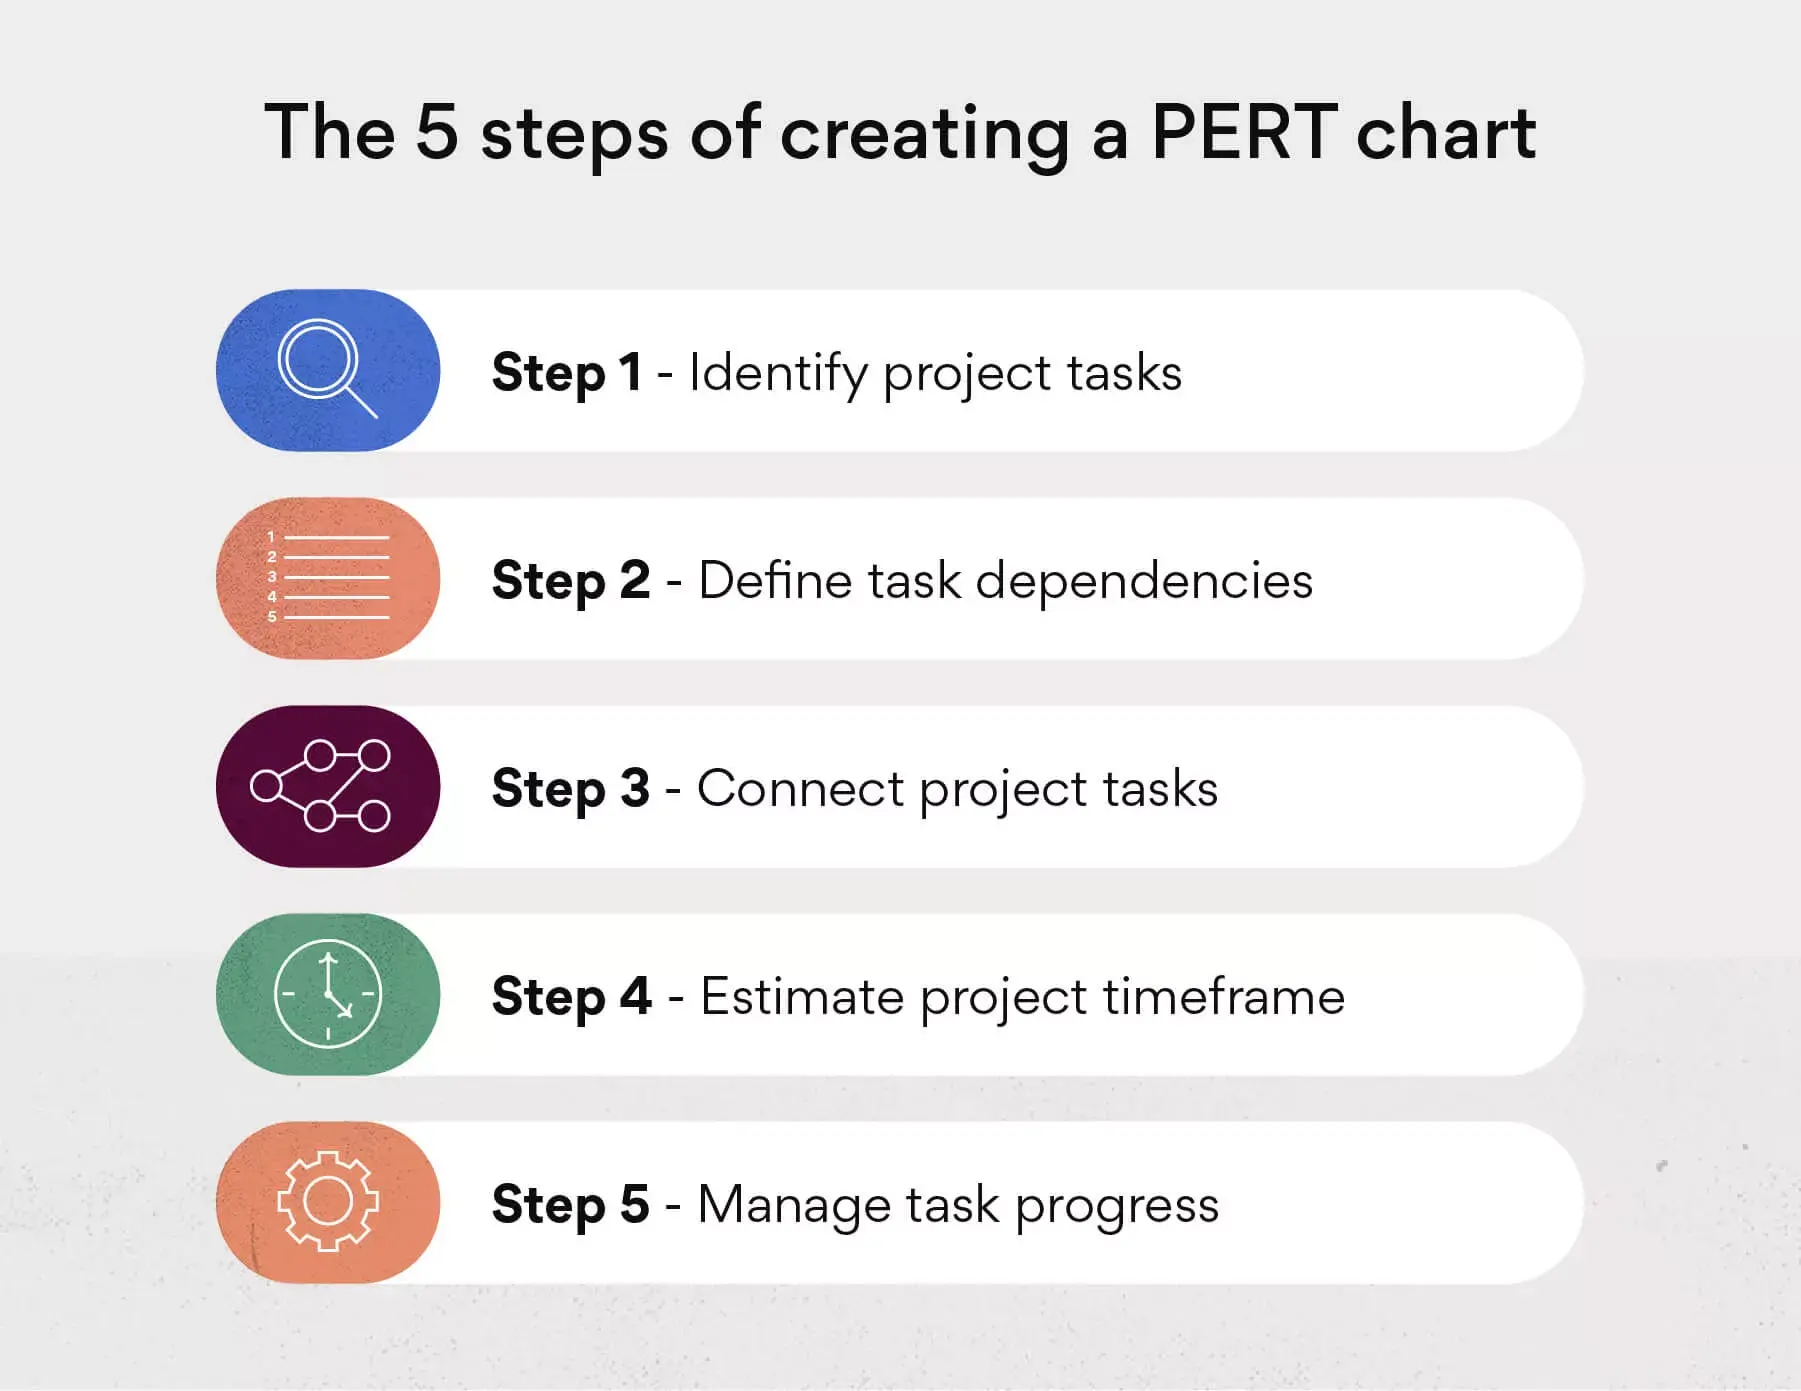
1. Identify project tasks
The first step in creating a PERT chart is the project planning stage, where you define the key project tasks that will shape your timeline. Before mapping out task dependencies, take time to gather essential details such as:
Laying this groundwork early ensures you're prepared to connect dependent tasks and establish a clear project scope before moving forward.
2. Define task dependencies
A task dependency is a task or milestone that must be completed before the task at hand can be started. Dependent tasks are a core part of the PERT method, often referred to as a logical relationship, and are commonly used in a work breakdown structure.
Creating dependencies can help you properly track work, ensure tasks are completed, and establish clear communication, especially for complex projects. Without well-defined dependencies, it's difficult to plan timelines and estimate overall project duration.
A PERT diagram visualizes dependencies by connecting and numbering tasks. While not as detailed as a work breakdown structure, it provides a clear overview of task relationships and required work.
Read: 12 tips to effective communication in the workplace3. Connect project tasks
With task dependencies established, start creating your PERT chart by connecting project tasks. These connections consist of arrows, which represent tasks, and nodes, which represent events or milestones.
For example, place parent events within your nodes (represented as numbered circles or squares) and draw task arrows to represent the dependencies needed to complete your events. This network diagram layout offers a simple structure that is straightforward for project stakeholders to understand.
4. Estimate project time frame
Now it's time to estimate your overall project time frame using the critical path method (CPM) and the PERT equation. The critical path is the longest sequence of tasks that must be completed to successfully finish an entire project.
The goal is to find the longest task sequence to estimate the shortest possible project duration. Time estimates in PERT analysis are based on:
Optimistic time: The minimum amount of time needed to accomplish a task.
Pessimistic time: The maximum amount of time needed to accomplish a task.
Most likely time: The best estimate of how long a task will take.
Using the PERT calculation, you can estimate task duration and completion time with the PERT formula:
Expected Time = (O + (4 × M) + P) ÷ 6
This can be measured in minutes, hours, days, or even weeks.
Pert calculation example:
For instance, if a task has an optimistic time of 30 minutes, a pessimistic time of 60 minutes, and a most likely time of 45 minutes, the calculation would be:
(30min + (4 × 45min) + 60min) ÷ 6 = 45 minutes.
Once you've completed the PERT estimates for each task, sum them along the critical path to determine the overall project timeline.
5. Manage task progress
The final step in creating a PERT chart is managing progress until project completion. This involves tracking task dependencies, resolving bottlenecks, and ensuring all project milestones are met.
A PERT chart in project management should be updated in real time as changes occur. Pairing it with a change control process can help track modifications and maintain clear communication.
Once all tasks are complete, archive project materials in a shared space for easy access to past PERT analysis examples.
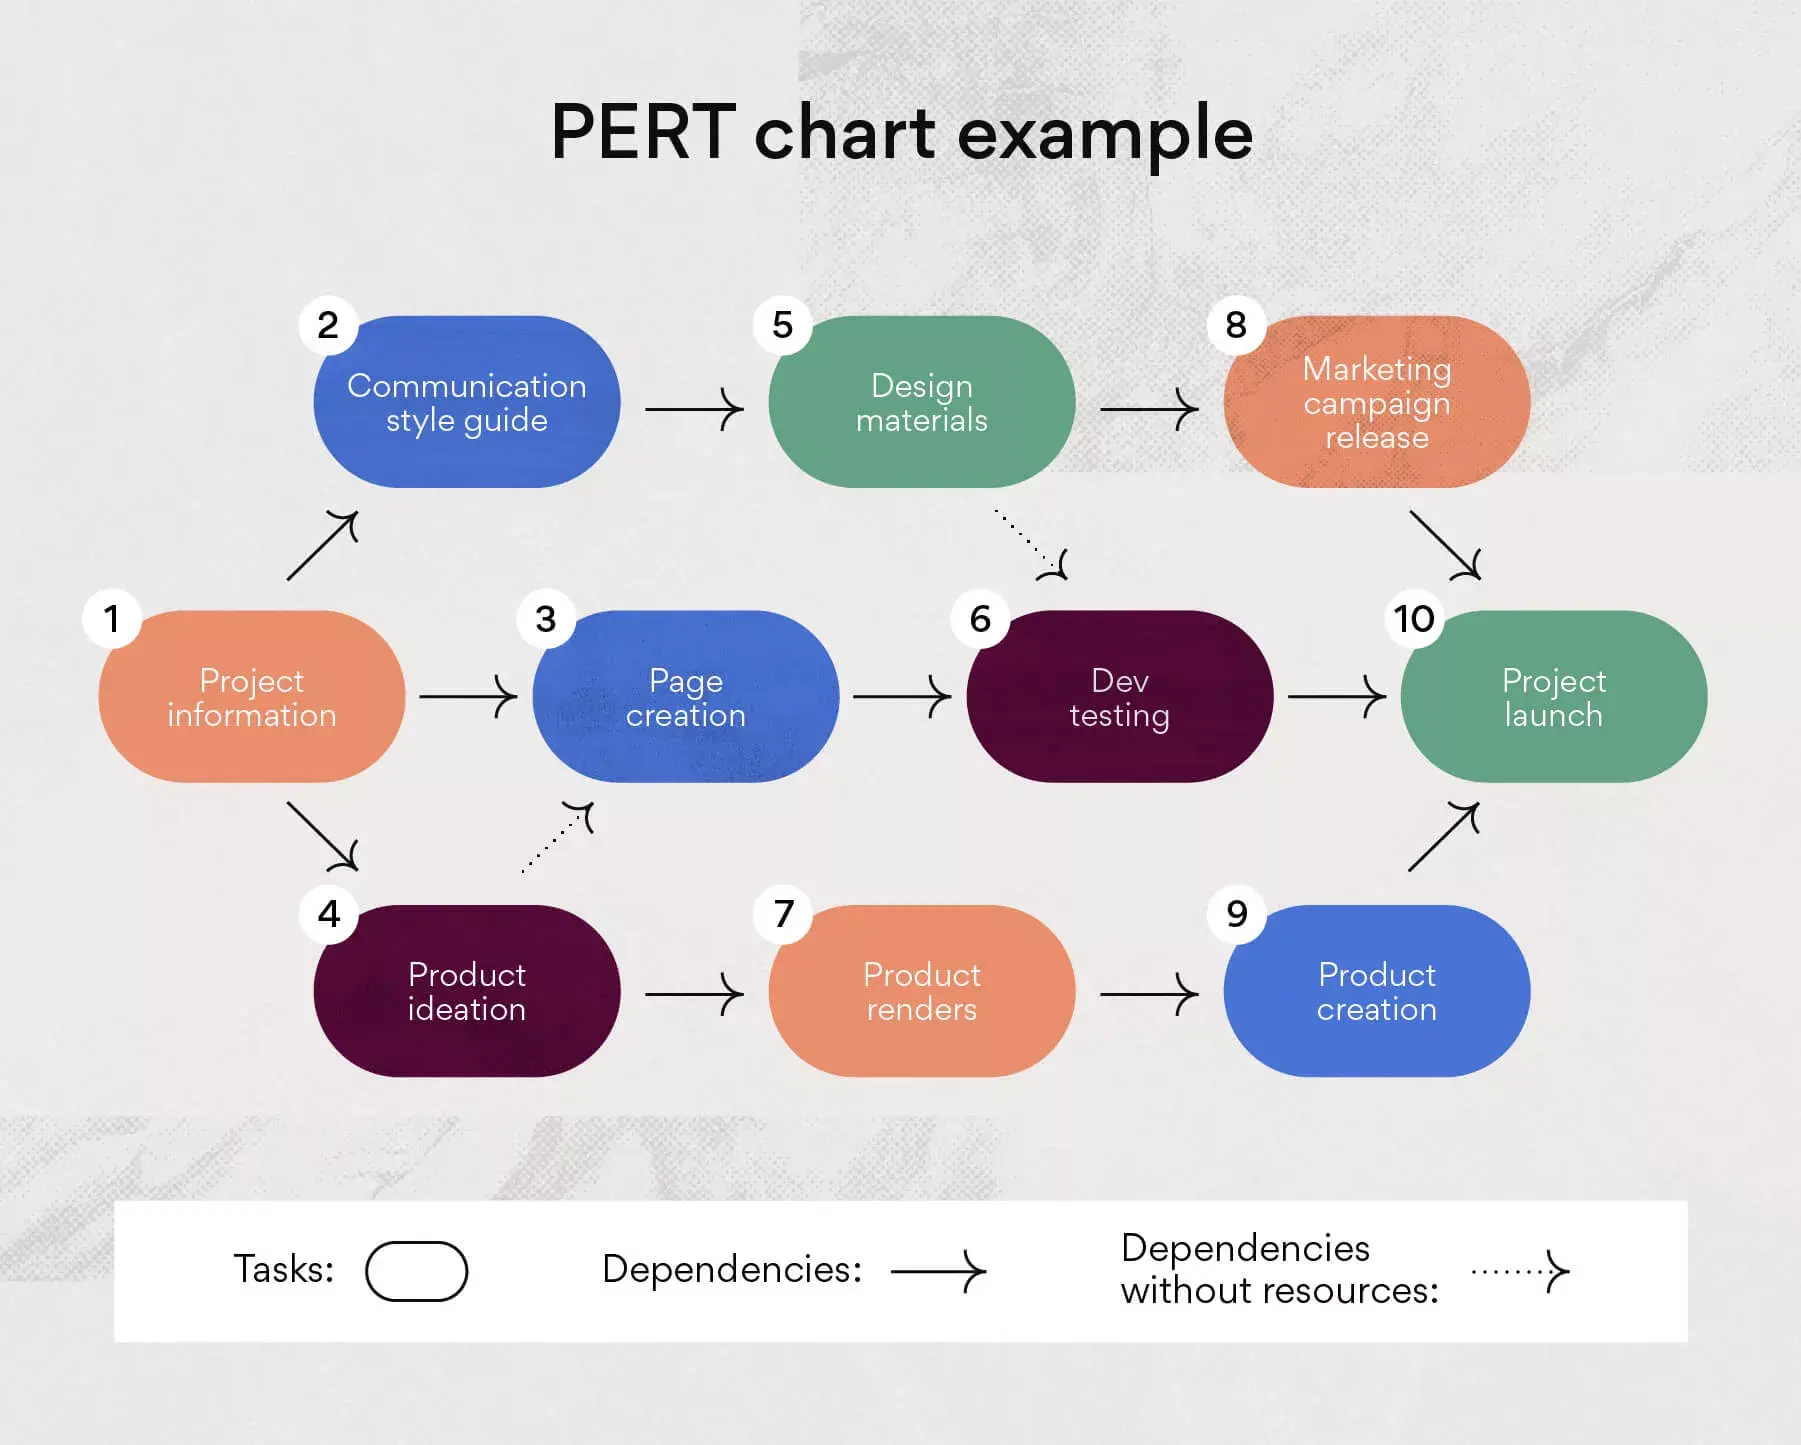
Read: Why a clear communication plan is more important than you thinkPERT chart example
Now that you understand how to make a PERT chart, it's time to create one of your own. Since every project varies in complexity and time frame, your PERT diagram may look slightly different. However, the core structure remains the same.
To start, follow these steps:
Drawing your numbered nodes: These represent the major project events, also known as parent tasks. When completed, these nodes will collectively form the full project. Your PERT diagram example might contain any number of tasks, but 10 is a good starting point.
Connect your nodes to tasks: Use arrows to illustrate task dependencies. These tasks must be completed to move forward with each milestone. While your PERT example should have a defined beginning and end, the middle can become more complex as dependencies branch out.
PERT chart example with solution
Here's a PERT example with a solution to give you a clearer picture of how these elements come together. Suppose you're managing a website launch:
What should a PERT chart template include?
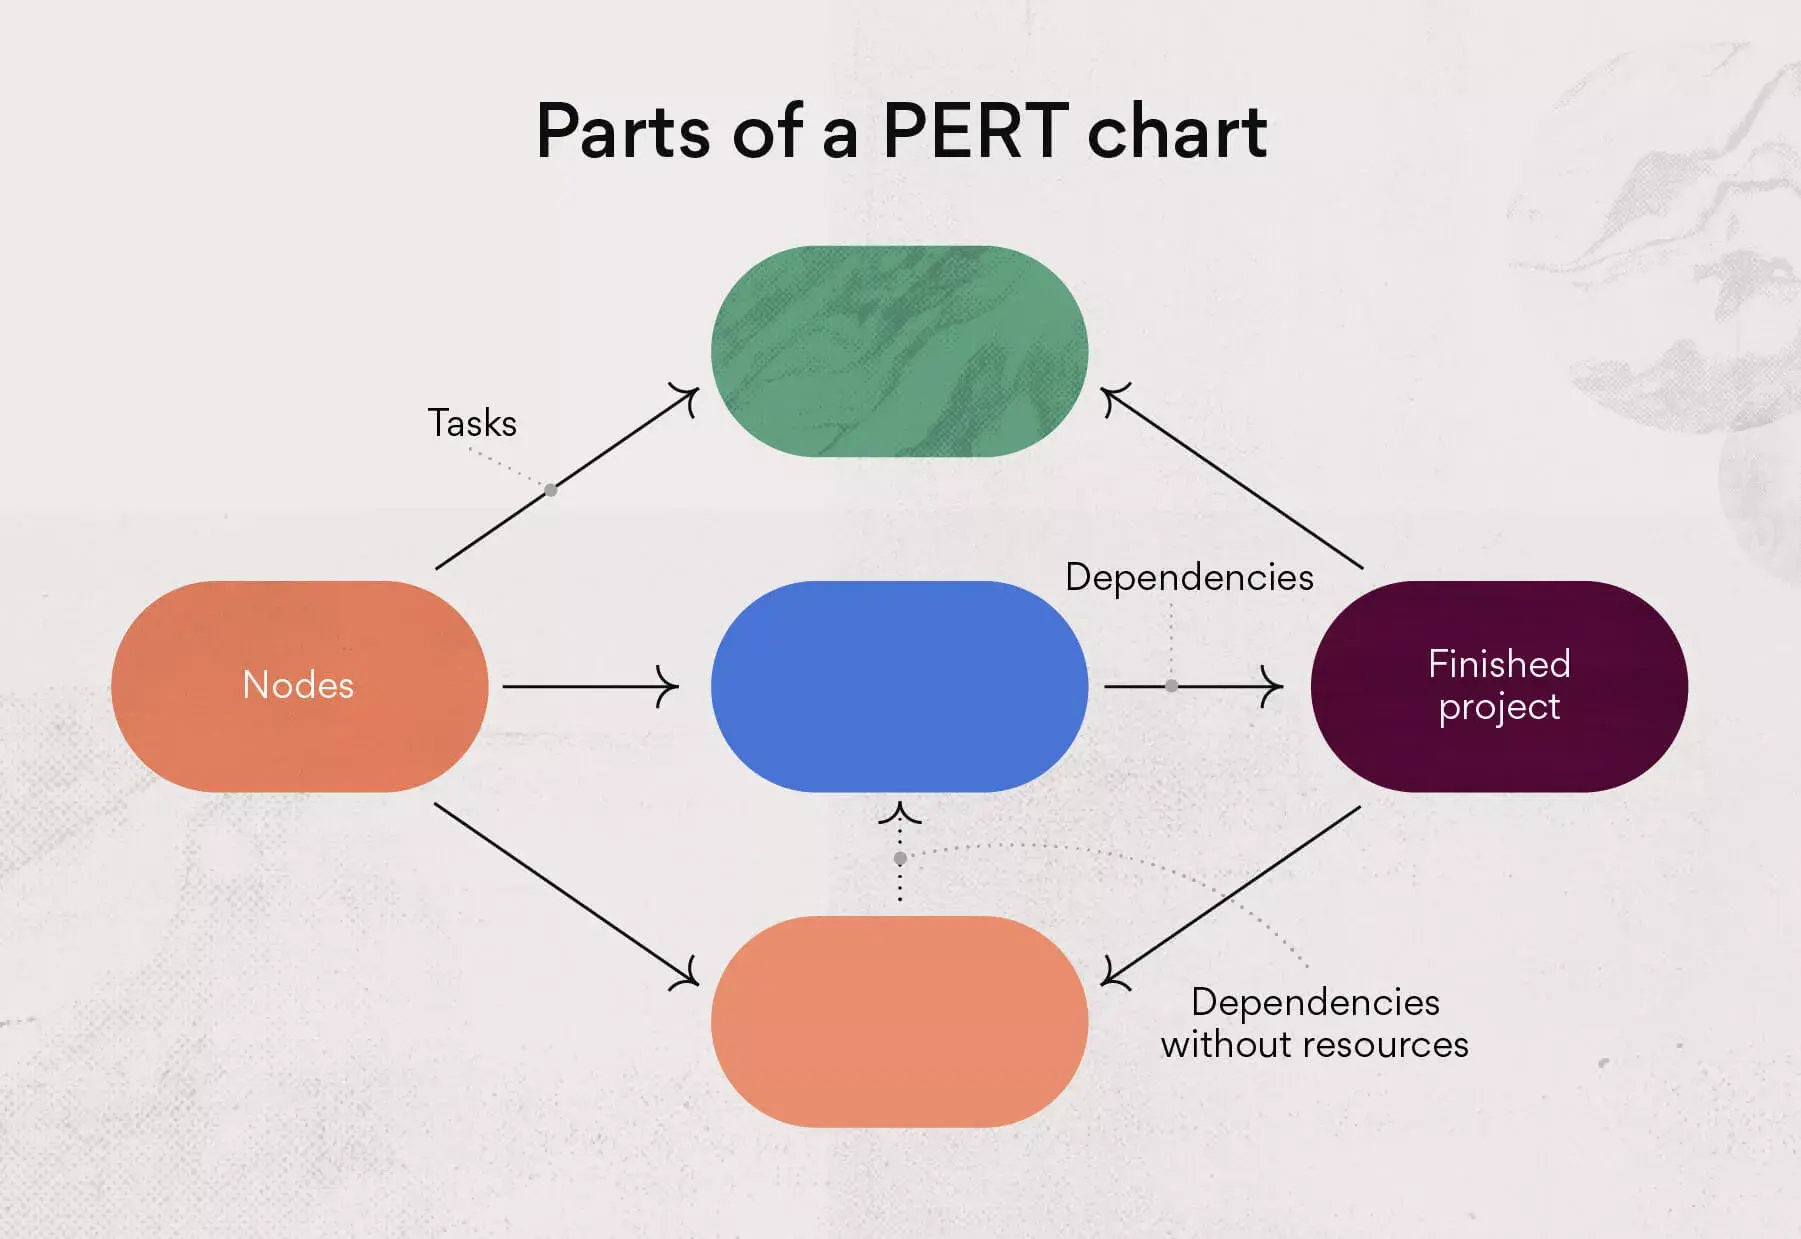
A PERT chart template typically includes several key elements to help structure and visualize project activities. Here's a breakdown of common terminology and its definitions:
Nodes: Nodes represent project events, the major components that make up your entire project. For example, in a website design project, a node might represent a new logo design.
Tasks: Tasks are the specific actions required to complete a node. For instance, if a node represents a new logo design, a task might involve creating three mockups of the logo.
Dependencies: Task dependencies indicate relationships between tasks, meaning one task must be completed before another can begin. For example, a landing page cannot go live until the copy is written and approved.
Dependencies without resources: Some dependencies exist without a direct task connection. For instance, while a product launch and a landing page may be related, they don't necessarily share a specific dependent task.
What's the easiest way to build a PERT chart template? Use a project management tool. It helps you map out task dependencies, keep an eye on the project timeline, and spot bottlenecks before they slow you down.
You can also pair your PERT chart template with visual tools like Lucidchart. These apps let your team members collaborate in real-time, tweak the project schedule on the fly, and keep everything on track for project completion, all in one place.
Try Lucidchart integration with AsanaPERT chart vs. Gantt chart
PERT charts and Gantt charts are often confused, though they have a few key differences. Here's a quick comparison:
Feature | PERT chart | Gantt chart |
Visual format | Flowchart (network diagram) | Bar graph (horizontal timeline) |
Best for | Planning and time estimation | Tracking tasks during execution |
Shows dependencies | Yes, as primary focus | Limited |
Layout | Flexible, customizable | Structured, organized |
When to use | Before project begins | Throughout project lifecycle |
Here are a few key features to note when deciding which one is right for you:
PERT charts are flowcharts while Gantt charts are bar graphs: Gantt charts use a traditional bar chart approach. PERT charts are less structured and take on different layouts depending on the project.
Gantt charts offer organization, while PERT charts offer customization: Gantt charts are more structurally organized. PERT charts allow simple layout customization, which is better for high-level project needs.
PERT charts can be used before the project begins: They're often used as visual guides during the project kickoff. Project managers then use a Gantt chart or work breakdown structure to map tasks during execution.
Gantt charts are more popular for tracking tasks throughout the project lifecycle, while PERT charts excel at time mapping in the initial planning stages. They can be used separately or together.
When to use a PERT chart
Use a PERT chart when you need to evaluate timelines, identify resource requirements, or determine a project's critical path. Here's when PERT is the right choice:
To determine the critical path: One of the key features of a PERT chart that sets it apart from other methods is its ability to determine a project's critical path. This is important when visualizing the overall timeline of a project.
To evaluate resources: With the unique features a PERT chart offers, you can easily display which tasks require resources and which don't. This saves both you and project stakeholders time by having that information upfront and accessible.
To estimate time: Since a PERT chart accounts for both individual task durations and overall project duration, it's a great tool for understanding the expected timeline during the initial project planning phase.
Overall, creating a PERT chart is a good option for a simple project plan that can easily be shared with team members. Use this chart to quickly share resources and timelines.
Advantages and disadvantages of PERT charts
Like any project management tool, PERT charts have their own set of strengths and weaknesses. Understanding them helps you decide if it's the right fit for your project.
Advantages of PERT charts
Clear visualization: They provide a clear visual map of the entire project, making it easier to understand task sequences and dependencies.
Improved forecasting: By using optimistic, pessimistic, and most likely time estimates, PERT helps create more realistic project timelines.
Dependency analysis: The chart clearly highlights task dependencies, helping teams identify the critical path and potential bottlenecks.
Better communication: A PERT chart is a useful tool for communicating project plans and timelines to stakeholders in a simple, visual format.
Disadvantages of PERT charts
Can be subjective: The time estimates are based on team predictions, which can be subjective and may lead to inaccurate timelines if not carefully considered.
Complex to create: For large projects with many tasks, creating and maintaining a PERT chart can be time-consuming.
Focus on deadlines, not resources: PERT charts are primarily focused on the project timeline and do not inherently account for resource management or budget.
Plan ahead with a PERT chart
A PERT diagram helps you accurately plan your next project. With a clear layout and timeline estimates, your team will have direction on tasks and be prepared for whatever comes their way.
Ready to take your project planning further? Get started with Asana to visualize timelines and track progress in real time.
Try Lucidchart integration with Asana