Organizational charts: How to create and use org charts (with template)

Summary
Organizational charts help you visualize where you and your team members fit within your company's structure. Also known as an organigram, an org chart outlines your team structure and illustrates reporting relationships between roles. In this guide, we'll cover what an organizational chart is and when to use one, walk through the different types, explain how to create one step by step, and provide free organizational chart templates to help you build your own.
Learn how to build an AI-powered organizational plan
Watch a short demo video to see how your company can create a plan that connects everyone’s work to company-wide goals.
What is an organizational chart?
An organizational chart (also called an organigram or org chart) is a diagram that maps out your company's internal structure, showing roles, reporting relationships, and how teams and departments connect. It provides a visualization of how your organization is set up, from top leadership to individual contributors.
The history of organizational charts dates back to the mid-1800s, when railroad engineer Daniel McCallum created one of the first to manage complex operations. Today, org charts have moved from paper to digital tools that teams use together.
What are the core components of org charts?
Key element | When to include it | |
|---|---|---|
Roles and titles | The names of jobs or positions people hold within the company. | Include this in every org chart so employees can see each person’s role. |
People | The individuals in each role, sometimes including names or photos. | Include names when the chart will act as an internal directory or onboarding resource. |
Lines and connections | Visual links that show who reports to whom. | Include this in every org chart to show managers, direct reports, and reporting paths. |
Departments or teams | Groupings that organize roles into sections like marketing, sales, or customer support. | Include this when the company has multiple functions, departments, or business units. |
Levels of authority | The layers between leadership, managers, and individual contributors. | Include this when employees need to understand decision-making levels or approval paths. |
Dotted-line relationships | Secondary reporting relationships, often used for project, program, or cross-functional work. | Include this when employees report to one manager but also work under another lead for specific work. |
Location or time zone | Where employees work, or the time zone they work from. | Include this for remote or distributed teams that need to plan meetings, handoffs, or coverage. |
Contact details | Work email, team channel, or another approved method for contacting each person. | Include this when the chart also serves as a team directory. |
Open roles or vacancies | Unfilled positions that the company plans to hire for. | Include this when leaders use the chart for workforce planning or hiring discussions. |
Last updated date | The most recent date someone reviewed or changed the chart. | Include this so employees know whether the chart reflects recent hires, promotions, or team changes. |
What are the benefits of creating organizational charts?
No matter your company’s size, an organizational chart helps your team communicate, plan, and grow. Here’s why organograms are useful:
They clarify roles and reporting relationships. Org charts make it easier for employees to understand who oversees specific functions, who reports to whom, and how various teams interact.
They improve communication. When everyone knows the chain of command, questions get directed to the right people, and projects move forward more efficiently.
They simplify onboarding. New hires can use org charts to understand the company structure and identify important contacts from day one.
They support workforce planning. Leaders use org charts to spot gaps where new roles might be needed or where positions overlap, making it simpler to plan for growth or restructuring.
They guide decision-making. Clear reporting lines and role definitions help managers assign tasks and projects more efficiently, improving overall productivity.
Types of organizational charts
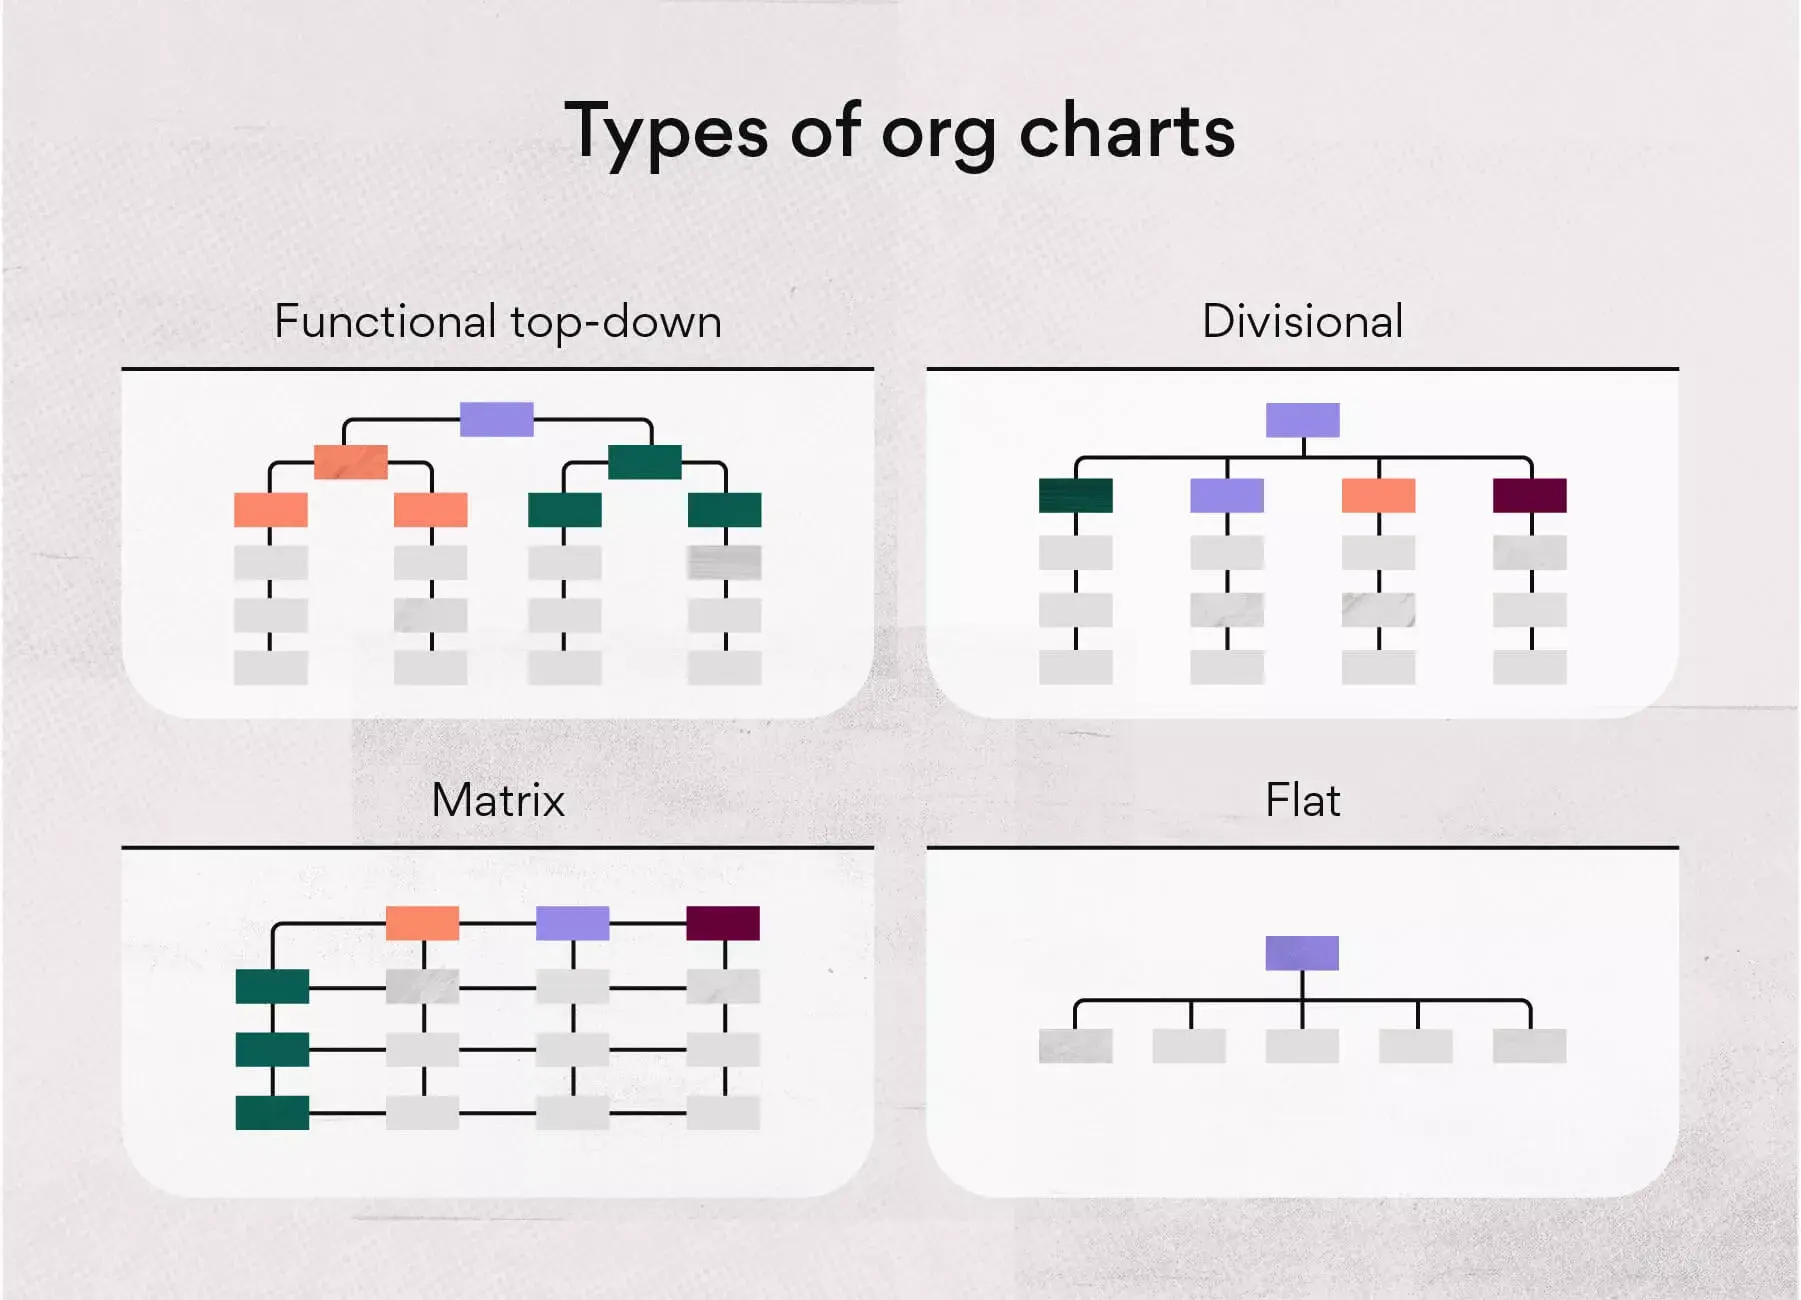
Before you create a business organizational chart, choose the format that best matches how your company groups people, assigns decisions, and manages work. The right chart type depends on your company's size, departments, leadership model, and whether employees support a single team or multiple initiatives.
Use the examples below to compare common org chart types and decide which one best represents how your organization works.
Type 1: Hierarchical
A hierarchical organizational chart shows the company from senior leadership down to individual contributors. It usually follows a top-down structure, with the CEO or executive leader at the top, department leaders below, then managers and team members under each function.
Use a hierarchical chart when you need to show the chain of command and who makes decisions at each level. For example, a larger company might use a hierarchy to show how the executive team, department directors, managers, and employees connect.
Type 2: Functional
A functional org chart organizes employees by specialty, such as marketing, finance, HR, sales, engineering, or operations. Each department has its own leader, and each employee usually reports to a functional manager who oversees work for that area.
Use a functional chart when teams work within specialized departments and need to show how each function supports the business. For example, a software company might group employees under engineering, product, marketing, customer support, and finance so employees know which department owns each type of work.
Type 3: Flat
A flat organizational chart shows a company with few levels between leaders and employees. Instead of several layers of middle management, team members may report directly to a founder, executive, or small leadership group.
Use flat org charts for startups, small businesses, or teams that make decisions with fewer approval steps. A flat chart can make the org structure easier to read, but it’s also confusing if teams do not document owners, responsibilities, and decision-making roles.
Type 4: Divisional
A divisional structure organizes employees by product line, region, market, or customer group. Each division may have its own sales, marketing, operations, finance, or support teams, depending on how independently the division runs.
Use a divisional org chart when a company manages separate business units that need their own leadership and resources. For example, a global company might create divisions for North America, Europe, and Asia-Pacific, or a media company might organize teams by streaming, parks, consumer products, and studios.
Type 5: Matrix
A matrix organizational chart shows employees who report to more than one leader. For example, a designer may report to a design lead for skill development and to project managers for campaign, product, or launch work.
Matrix organizations use these charts to illustrate how teams share people between departments, programs, or projects. Matrix charts work well for cross-functional work, but they need documented reporting lines so employees know who reviews performance, who assigns work, and who makes final decisions.
Read: The ultimate guide to building organizational strategyHow to make an organizational chart
Creating organizational charts starts with deciding what your chart needs to show and who will use it. Before you use our org chart template, gather the correct employee details, confirm reporting relationships, and choose a format that matches your company’s structure.
1. Define scope
You can treat your organizational chart like any other new project you work on. Defining the scope of your org chart can help ensure it clearly represents your team structure. The scope will determine the overall purpose of your organizational chart.
To begin, consider the following questions:
Will your org chart act as a resource for team members to know who's who within the company?
Will you share your organizational chart with external stakeholders or partners?
Will you need multiple charts for different levels of the company?
By asking these questions early, you can collect the right details and plan your chart well.
2. Gather information
Getting accurate information is key to building a reliable chart. You can do this by emailing team members or working with your HR department.
Here's what you'll need to collect:
Employee names and current job titles
Reporting relationships (e.g., the hierarchy between managers and direct reports)
Department or team assignments
Headshots for added personalization (optional)
3. Decide how to build your chart
Choosing the right tool to build your organizational chart makes the process easier. Drawing it by hand takes time and is hard to share, so it’s better to use a digital tool. An editable PDF template can save you time since it’s already set up with placeholders. You can easily share it with your team.
4. Plan for updates
After creating your org chart, use a team calendar to plan for regular updates. After all, it's likely that your company structure and team dynamics will change often. As people change roles or new employees join, reporting lines can shift. A digital org chart makes it easy to update and share these changes with your team.
Organizational chart templates
It’s easier to create an organizational chart when you start with a template. Most companies use similar structures, like top-down or matrix charts. Use the org chart examples below as a starting point. Pick the type that best fits your company, then update the free template to suit your team.
Free team organizational chart templateOrg chart examples
The example below shows a basic top-down org chart. The head of the company sits at the top, department heads sit beneath that role, and team members appear under the department they support. This format works well for smaller companies or teams that need to show reporting relationships without adding too much detail.
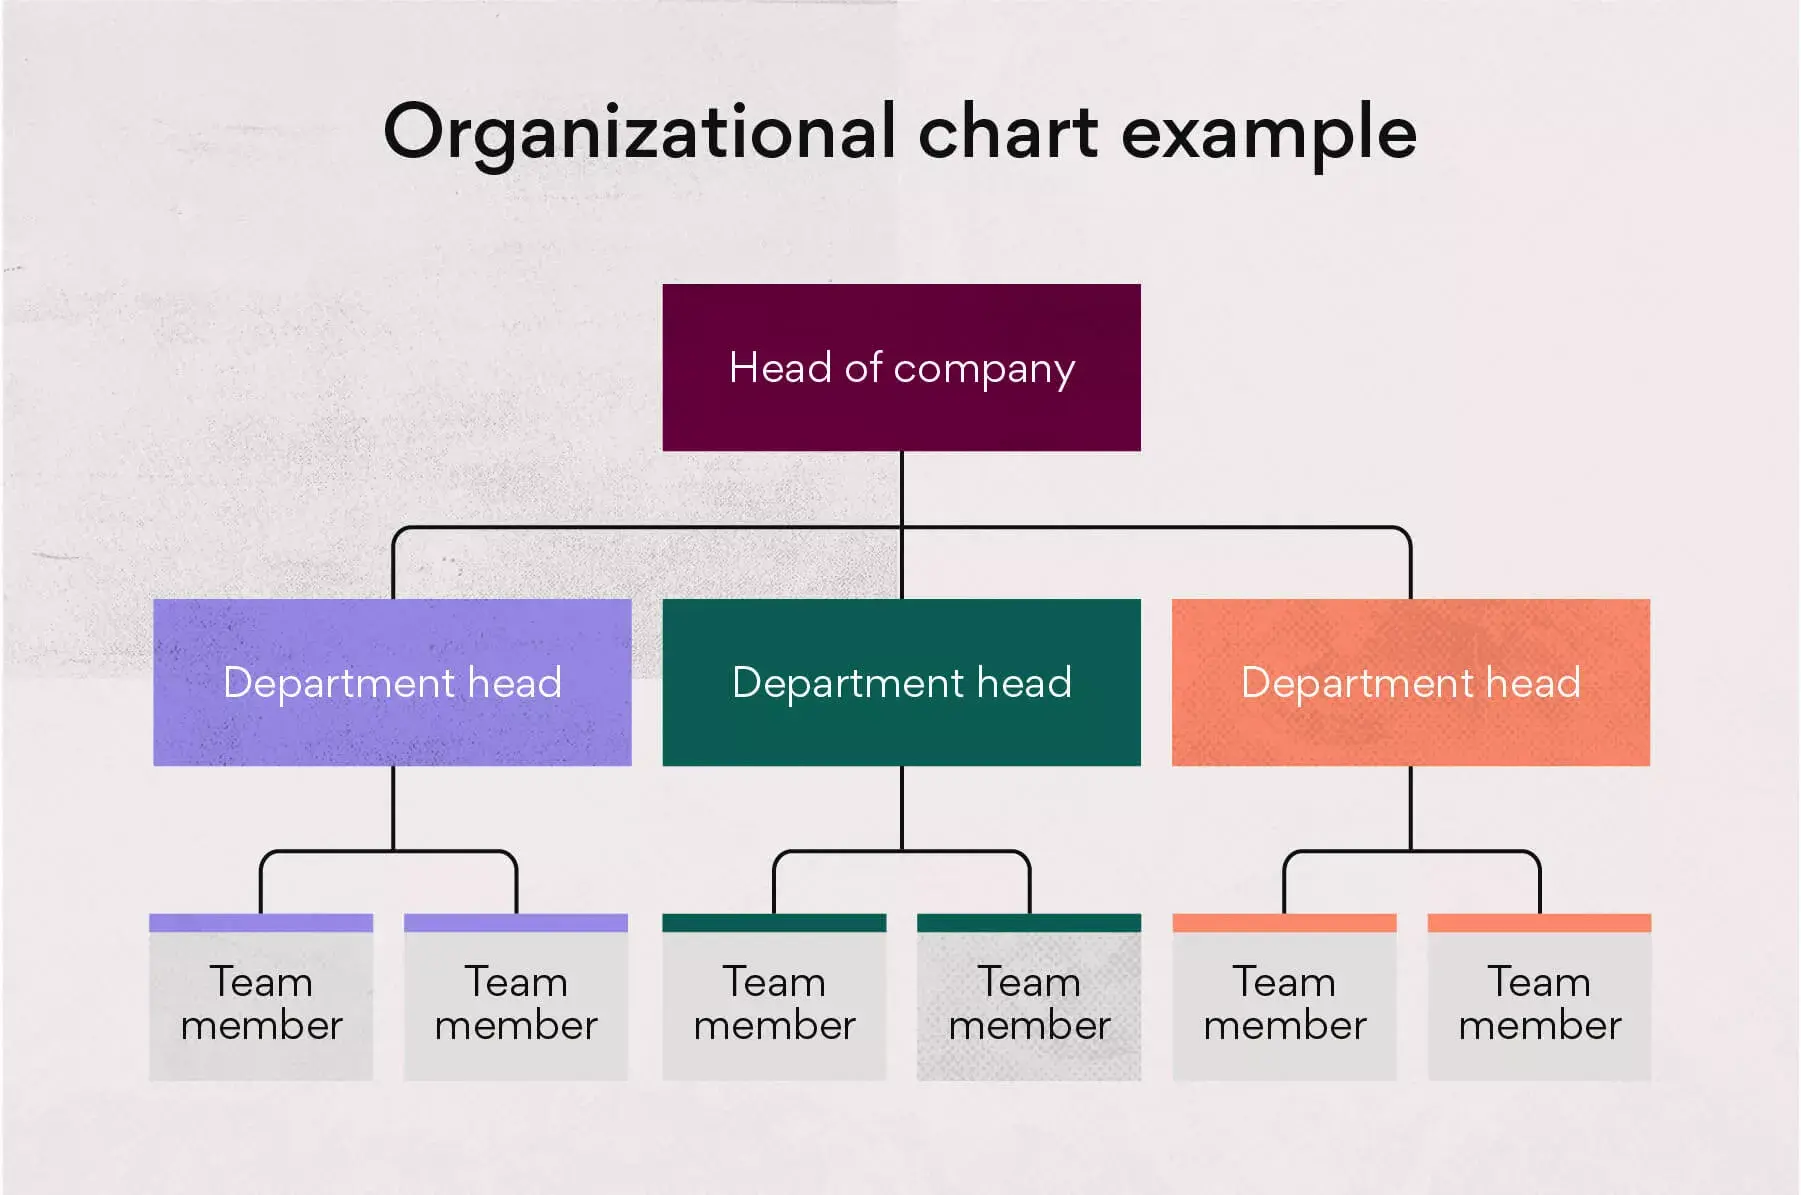
Use this example as a starting point when mapping leadership, departments, and direct reports. You can replace each placeholder with employee names, job titles, departments, or open roles, then update the chart as the team grows or responsibilities change.
Read: What’s right for your company? Decision making in 3 different organizational structuresHow to use an org chart
Using an organizational chart provides a clear visual of different departments and job titles in action, helping team members collaborate effectively and feel confident in their roles and responsibilities.
Visualize reporting relationships: Managers can use org charts to show new team members their responsibilities and who they report to. During onboarding, org charts help employees learn who does what and remember coworkers’ names.
Manage growth and change: Organizational charts can help leaders plan for growth or company changes. For example, if a department head sees that one team has grown much larger than others, they can review whether they need to shift responsibilities or hire additional team members.
See where everyone fits: An org chart helps employees understand where their role fits within the company. New team members can quickly find their team, manager, and how their department connects to other groups.
Improve communication: An org chart shows who leads each team, which helps employees direct questions, requests, and approvals to the right person. Without one, team members may not know who owns a decision or who can answer specific questions.
Create a visual directory: An org chart can act as a visual directory for your company. Update it when employees join, move roles, or leave so people know who works on each team and what role they hold.
Pros and cons of using organizational charts
Org charts are helpful, but they have some drawbacks. Knowing the pros and cons helps you create a structure that fits your team’s needs.
Pros of organizational charts | Cons of organizational charts |
|---|---|
Helps team members understand reporting relationships and how their roles fit into the company structure. | Company restructuring, promotions, departures, and new hires require frequent updates. |
New hires can quickly learn the team structure, leadership hierarchy, and key points of contact. | Most org charts do not show dotted-line reporting, informal teams, or cross-functional work. |
Leaders can review workflows, assign resources, and adjust the organizational structure when responsibilities change. | An org chart shows hierarchy, but it does not explain how leaders manage, communicate, or make decisions. |
Teams can use an org chart to review the current company structure before making hiring or reorganization plans. | Static charts require manual updates, though org chart software and apps like Asana make revisions easier. |
Platforms like Lucidchart, Microsoft Excel, PowerPoint, and Asana let teams update charts, share changes, and connect structure to project work. |
Streamline your structure with an org chart
Org charts aren’t perfect, but they make it easier to understand your company’s structure and improve communication. Use our free editable PDFs to create and customize a chart for your team.
Ready to bring more clarity to how your teams work together? Asana helps you organize projects, clarify responsibilities, and keep your team connected. Get started.
Get your organization's custom Work Innovation Score
Chart your organization's path to innovation with Asana’s new AI-powered benchmark